
Regular users of our Map of Science may have noticed a few changes recently. Earlier this month, we integrated a new summary view feature into the Map's interface. Summary view is useful for discovering the high-level trends and key players within a given area of research - say, computer vision research, fast-growing chemistry research, or AI research with a lot of industry involvement.
In fact, you can use summary view to analyze any type of research that you can describe using the Map's filters, making it a great way to draw high-level insights about the research that interests you most.
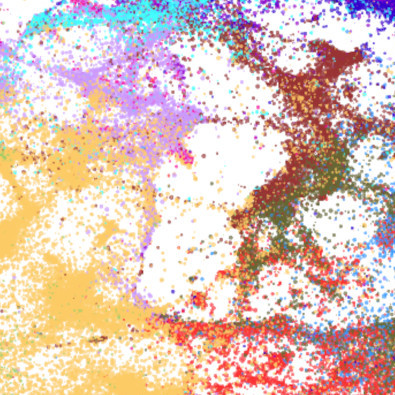
To understand how the new view works, recall first that the Map of Science is made up of thousands of clusters, or groups of articles that cite each other frequently (typically because they share other things in common, like topics or languages). ETO's Research Cluster Dataset includes extensive metadata on each cluster, derived from the articles that make up that cluster. When you click on a cluster in the Map of Science, you see this metadata organized into a profile - for example, here's the profile for a cluster of research into speech recognition in noisy environments.
In a nutshell, summary view displays a similar profile for all of the clusters that match the filters you've applied, rather than for one single cluster (which was all you could do before summary view was introduced). When you launch summary view, the Map aggregates the metadata from all of the filtered clusters and builds it into a single profile. The summary view profile itself looks and acts similar to the profiles for individual clusters.
Let's walk through a specific example. You've probably heard a lot recently about "large language models," a category of artificial intelligence systems based on natural language processing (NLP) techniques. Say you want to learn more about the NLP research landscape. How fast is it growing? Who are the key players, and who's funding their work?
To explore this question, we'll set up filters to identify clusters in the Map of Science that meet a specified threshold of "NLP-ness," then analyze them in the aggregate using summary view. Start with the filters. The Map's "hot topics" pane has a filter for clusters with a specified amount of English-language NLP research. Let's set it to a significant NLP share - say, 10%:
Switch over to summary view for information about the 1,338 clusters that match our filter.
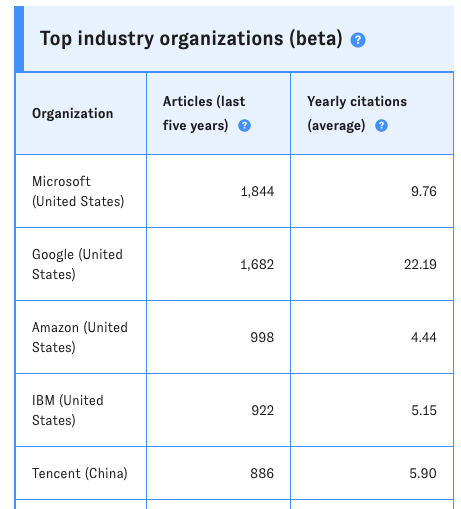
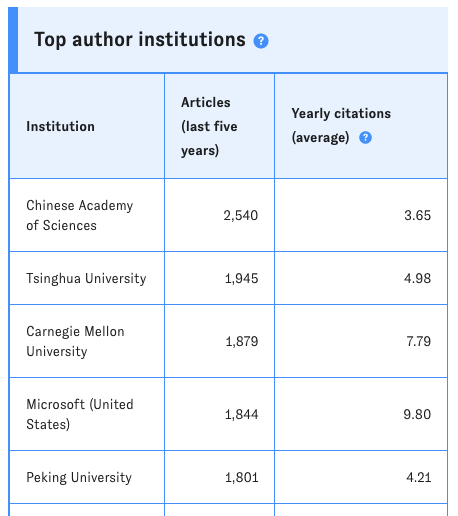
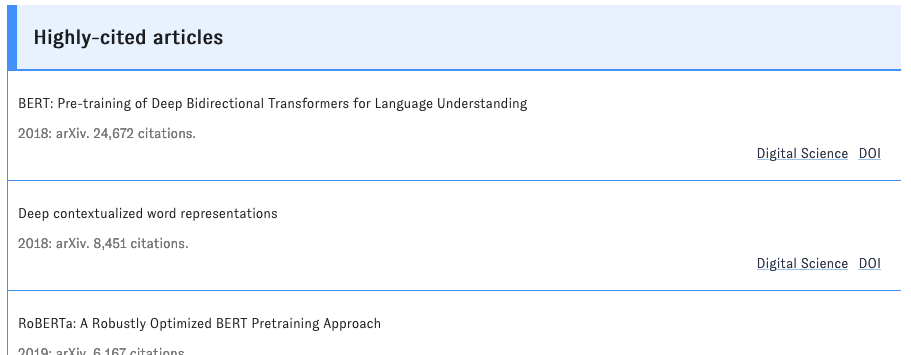
We can see, for example, that Big Tech companies like Microsoft and Google are heavy hitters in these clusters. Chinese and British research institutions are also well represented, as are China's science funding agencies. Scroll through the view to see more details about growth, patenting, key papers (Google's BERT appears especially influential), and more.
As you browse, keep in mind that these results are based on a particular method of identifying relevant research. Essentially, we've equated NLP research with the clusters in the Map of Science that meet our NLP filter (here, the presence of 10% or more NLP papers). As you run similar experiments of your own with the Map, it's important to consider the tradeoffs of this approach. For instance, in our NLP example, there are probably lots of articles in the filtered clusters that don't individually focus on NLP, but have been associated with more directly NLP-related articles through our automated clustering process. (Depending on your perspective, this could be a perk or a drawback.)
Experimenting is easy, by the way: just add, remove, or modify filters as you please, then hit "Apply filters" to generate a new summary view. Any combination of filters is fair game - for example, try summarizing:
- Advanced materials research
- Fast-growing research
- Highly cited AI research
- Areas where German researchers play a leading role
- Biology research of particular interest to industry
In the coming weeks, we'll show off insights from summary view in our Datapoints series. If we can help you make use of this powerful new feature in the meantime, just drop us a line.