To learn about trends in different research areas, many people turn to expert-curated resources such as review papers, specialized journals, or conference agendas. ETO’s Map of Science and its citation-based clusters take a more directly data-driven approach, using clustering algorithms and publication metadata to highlight hotspots in the research landscape. Could combining the two methods lead to better understanding?
At this year’s Smart Materials, Adaptive Structures, and Intelligent Systems (SMASIS) conference, CSET’s Jaret Riddick presented a keynote address entitled “Nanomaterials: Then, Now and Over the Horizon – Policy Implications.” Riddick’s keynote used the Map of Science to examine changes in SMASIS conference research between this year’s meeting and the 2018 conference, exploring whether trends apparent in the conference proceedings could be confirmed with the Map of Science. Ultimately, trends validated by the Map of Science can be used to inform funders and policymakers seeking to speed progress.
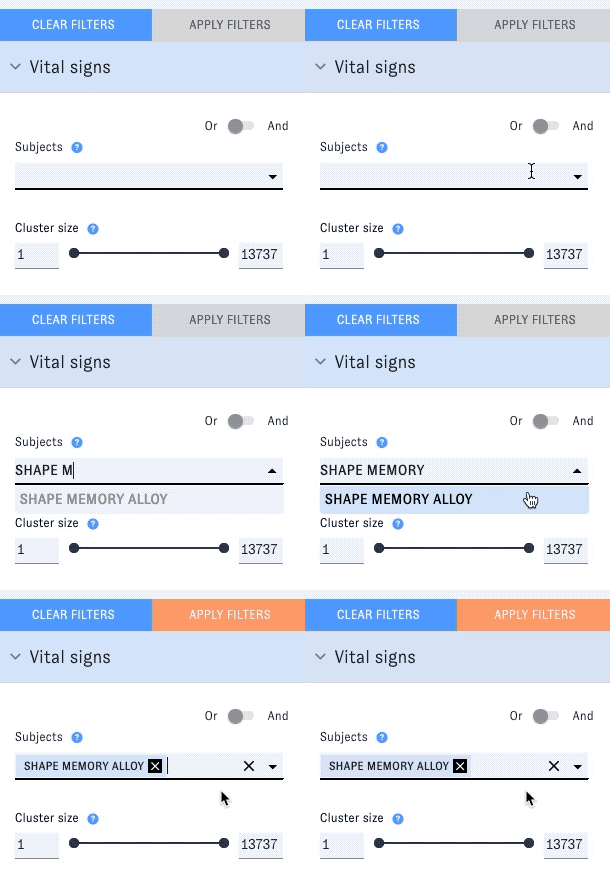
The 2018 and 2023 SMASIS conference proceedings are divided into symposiums, each composed of several sessions of papers. In his analysis, Riddick used session titles to identify key subject areas in each year, then used these key areas as queries for the Map of Science subject search. For example, SMASIS 2023 session titles included nearly a dozen occurrences of the term “shape memory alloys (SMAs),” making this a key subject area. Therefore, Riddick searched the Map for “shape memory alloys (SMAs).” Finding active clusters in this area would corroborate the attention given to the topic at SMASIS, and potentially point to specific research publications, actors, or themes to explore further.

Some of the key subject areas Riddick examined were present in the SMASIS conference proceedings in both 2018 and 2023, indicating sustained research interest over a five-year period. These key areas included materials, shape memory alloys, composite materials, design, and sensing. A Map of Science query for shape memory alloys identifies 33 clusters, with 2 predicted to have extreme growth. Among those two, Cluster 33375, an engineering-related cluster, covers concepts such as shape memory polymers, printed shape memory, soft polymer materials, and additive manufacturing. Papers in the 2023 SMASIS conference proceedings included all of these concepts.
Other topics emerged as key subject areas for the first time in the SMASIS 2023 proceedings. According to Riddick, these included structures (including smart structures), actuators, and robotics. A Map of Science query for actuators returns 68 clusters, including 4 clusters predicted to have extreme growth. Those four clusters contain 5,539 total articles over the last five years. The average article age across the four clusters is 4.73 years. Three of the four, namely 53045, 3322, and 12735, all engineering-related, cover concepts including artificial muscles, soft robotics, and hydrogel. Again, papers in the 2023 SMASIS proceedings included all of these concepts.
The final category included key subject areas in the 2018 proceedings that were not key subject areas for the 2023 conference - that is, they were not present in the 2023 conference’s session titles. These subject areas included modeling, controls, active/adaptive, and morphing. Note, however, that these subject areas were referenced in paper titles in the 2023 proceedings. This may indicate that rather than going away in the five-year interim, these subject areas have evolved into enablers embedded into new research. Querying the Map of Science for morphing reveals 4 clusters, including one each in physics (35783) and engineering (3115). Key concepts among these two clusters that were addressed by papers in the 2023 proceedings include bistable composite laminates, morphing trailing edge, and smart morphing wing.
In summary, Riddick was able to use the Map of Science to map trends in the research for the SMASIS conference between 2018 and 2023 onto real-world research activity. The implication is that publicly available conference proceedings from well-established research communities can be used, in conjunction with the Map of Science’s data-driven clusters, to analyze and validate research trends. This validated analysis will allow policymakers to understand the status of research in the field, which countries and institutions are most active, industry engagement, and patenting, among other topics. This analysis could be useful to decision makers considering future R&D policy pathways and funding decisions, or even future hires, such as university research faculty.
For more resources on the Map of Science, visit the documentation or read our prior blog posts on the tool. 🤖

