Overview
What is this tool?
The Country Activity Tracker (CAT) is a dashboard of AI activity at the national level. It includes metrics on research, patents, and private-market investment, providing insight into AI competition and cooperation around the world. Users can compare AI activity statistics for any country or group of countries worldwide, explore data on specific AI subfields and applications, and track AI-related collaborations and exchanges between nations.
What can I use it for?
You can use CAT to:
- Measure a country's AI activity using CAT's metric groups: research, patents, and private-sector activity (companies and investments). Each group includes detailed metrics and data on trends over time.
- Measure activity within different AI subfields and application areas using any of CAT's metric groups.
- Compare countries across different metrics of AI activity. Users can build customized lists of countries, regions, and political groupings to compare across many of CAT's metrics.
- Track trends in transnational AI activity, such as cross-border investment and research collaboration.
- View leading AI organizations and companies within a country or group of countries using CAT's "top ten" lists.
Get updates
What are its most important limitations?
- CAT is AI-specific. CAT only covers AI-related activity. (See below for details about how we identified "AI-related" publications, patents, and companies.) If you need data on other types of emerging technology, ETO may have another tool that can help.
- CAT focuses on countries, not organizations or individuals. CAT is a tool for tracking and comparing country-level activity. It includes some information about individuals and organizations, but isn't designed to support analysis at that level.
- CAT's metrics may not give a complete picture of a country's AI activity. There are many ways to assess countries' AI activities. CAT includes three metric groups - research, patents, and private-sector activity (companies and investments) - that we think are meaningful, but they aren't exhaustive.
- CAT inherits additional limitations from its source datasets, including:
- Company and investment metrics capture a particular type of investment activity, and don't represent everything happening with AI in the private sector. Read more >>
- Patent and publication data have a lag, making counts incomplete for recent years. The lag is especially significant for patent data.
- Possible errors or gaps in our assignment of publications to countries. We run raw author affiliation data provided by our sources through our own internal entity resolution model to identify the correct country of author affiliations. Our pipeline demonstrates improvements over raw affiliation data, but some publications remain unlinked to countries or may be linked to the wrong country. Read more >>
- Publication metrics are based on primarily English-language sources that miss many Chinese-language publications. Read more >>
What are its sources?
CAT runs on ETO's Country AI Activity Metrics and Cross-Border Tech Research Metrics datasets. Limited additional data on cross-border patenting and investment, as well as data individual organizations, documents, and people, derives from ETO's Merged Academic Corpus for research publications; The Lens, PATSTAT, and 1790 Analytics data for patents; and Crunchbase for company and investment data. Read more >>
Does it contain sensitive information, such as personally identifiable information?
No.
What are the terms of use?
CAT is subject to ETO's general terms of use. If you use the tool, please cite us.
How do I cite it?
If you use data from CAT in your work, please cite the "Emerging Technology Observatory Country Activity Tracker: Artificial Intelligence" and include the link to the tool.
Using CAT
How do I use it?
CAT includes three basic views, one for each "dataset" or metric group - research, patents, and private-sector activity (companies and investments). Each view includes a different set of customizable tables and visuals.
Getting started
Start with the selection bar at the top of the tool:
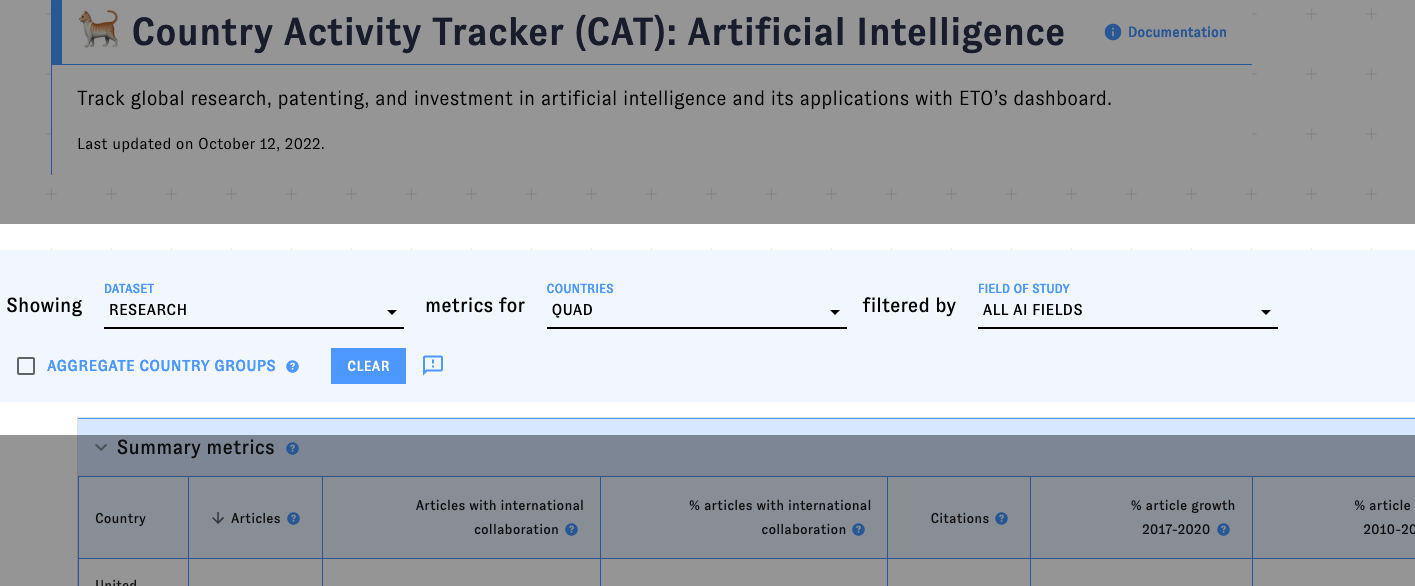
Use the "Dataset" dropdown selector to choose a group of metrics to display - the tool will update automatically to match your selection. Then, use the other selectors to specify:
- The country or countries you'd like to analyze with those metrics. The list includes individual countries (including some notable territories), regional groupings (Africa, Oceania, etc.), and certain political groupings (NATO, EU, etc.) You can choose more than one country or group of countries to analyze; type into the dropdown to navigate the list more quickly. If you select one or more groups of countries, you can check the "Aggregate metrics for country groups" box to make CAT display metrics at the group level, rather than displaying metrics for each individual country in the group.
- The AI subfields or application areas to include in the analysis. The default is "all AI." The options in this dropdown will change depending on whether research, patents, or private-sector activity are selected.
You can restore the defaults at any time with the "Clear" button.
Reading and modifying individual tables and graphs
Look for dropdown menus, sorting buttons, and similar elements in the CAT tables to customize your analysis. The data in each table will update in real time as you make your selections.
Hover over the "?" icons to learn more about different sections and data points.
Coming back to a view
As you work with CAT, your browser's address bar will update to reflect the applied filters and selections. Copy the URL in order to return to the same view later.
What can I use it for?
Measuring a country's AI activity using CAT's three metric groups: research, patents, and private-sector activity (companies and investments). Each group includes detailed metrics and data on trends over time.
Comparing countries across different metrics of AI activity. Users can build customized lists of countries, regions, and political groupings to compare across many of CAT's metrics.
Tracking trends in transnational AI activity, such as cross-border investment and co-publication.
Identifying leading AI organizations and companies within a country or group of countries using CAT's "top ten" features.
Which uses are not recommended?
- Researching individual authors, inventors, or publishing organizations. CAT is a tool for tracking and comparing country-level activity. Data on individual authors, articles, and inventors, is taken from our data sources and may contain errors or gaps.
- Measuring investment in large (publicly traded) AI companies. CAT's investment metrics only cover private-market investment flows, such as venture capital. It excludes all investment in publicly traded companies, such as the "Big Tech" firms. There is no data specific to these larger companies in CAT, and the country-level investment numbers don't include any investments into them.
- Measuring AI patenting by inventors from a specific country or countries. CAT's patent metrics describe where patents are being filed, not where the inventors of patents or organizations filing patents are located. In other words, CAT can't tell you how many AI patents are owned by Americans, but it can tell you how many patent families were first filed in the U.S. patent office, which is generally considered a good proxy. Read more >>
Sources and methodology
ETO's Country AI Activity Metrics and Cross-Border Tech Research Metrics datasets are the source of CAT’s country metrics and research collaboration metrics.
Data on individual research authors and articles are taken from CSET’s Merged Academic Corpus. Patent cross-filing metrics are derived from The Lens, PATSTAT, and 1790 Analytics. Cross-border investment metrics are derived from Crunchbase.
Sub-country data: identifying top publication authors
The top ten authors for each country are the ten authors with the most citations to articles they released while affiliated with organizations in that country. (We exclude authors with fewer than five articles published in the last 10 years.) Authors may appear in the top ten for multiple countries if their output in each country qualifies them for each country's list. For example, if Professor Smith publishes highly cited articles in Texas and in Tokyo, she might make the top ten list for the United States (based on her Texas articles) and for Japan (based on her Tokyo articles).
Note that the "Affiliation" column for each author in the "Top Ten Authors" table is populated using the organization where the author received the most citations. For example, if Professor Smith worked at Georgia Tech before moving to Texas, but the articles she published in Georgia have fewer total citations than the articles she published in Texas, she would be listed in the table as affiliated with the University of Texas, not Georgia Tech.
Sub-country data: identifying top patent assignees
A patent's assignee is the person or organization that owns the property right to the patent. CAT includes a list of the ten assignees with the most patents granted by each patent office. This list is compiled from raw assignee data in The Lens, PATSTAT, and 1790 Analytics. We don't currently normalize this data, so errors may appear (for example, misspelled assignee names or patents split across different spellings of the same assignee). A single granted patent may be associated with more than one assignee if multiple inventors filed it jointly or if its inventor sells or otherwise transfers it to someone else.
Sub-country data: identifying top companies
CAT includes a list of the ten companies in each country with the most investment received. This list is compiled from raw Crunchbase data. We don't currently normalize this data, so errors may appear.
Counting patents: Patent families and patent documents
In CAT, rather than count individual patent documents, we count patent families. This is because the same invention or concept often generates multiple patent documents; it can be submitted in different countries, resubmitted with corrections or amendments in the same location, etc. As the goal is to track the innovation rather than the individual document, patent families do this better, and avoid duplicate counts.
When tracking patent country, CAT uses the country a patent is first filed in, which is a proxy for the country of the patent inventor or organization. See the CSET report Patents and Artificial Intelligence: A Primer for more details.
The one case where CAT uses the country of patent documents besides the first filing in a patent family is in considering cross-filing activity across jurisdictions within a patent family.
Cross-border patent and investment metrics
Cross-border patent and investment metrics appear in CAT's "Cross-filing activity" and "Cross-border investment" tables. We use the same methods described in the Country AI Activity Metrics documentation to link patents and investment transactions to individual countries. We then use the methods described in the "Cross-filing activity" and "Cross-border investment" tables to identify patents and investment transactions that can be attributed to more than one country.
The cross-border investment metrics in CAT should be interpreted with care. Most private-market AI investment transactions, such as venture capital deals, combine contributions from multiple investors, and the exact amount of each investor's contribution is rarely disclosed. This makes it impossible to add up the total investment from investors in a specified country. Instead, the cross-border investment metrics reflect the total value or count of investment transactions with at least one participating investor from that country.
Maintenance
How is it updated?
The CAT user interface is updated as new features are developed. The underlying data is currently updated a minimum of once a quarter, although we plan to automate more frequent updates within the next year.
How can I report an issue?
Use our general issue reporting form, or click on the "Submit feedback" icons embedded in the tool to report issues related to specific data points.
Credits
- Concept: Husanjot Chahal, Sara Abdulla, Jennifer Melot, Ilya Rahkovsky
- Design and analysis: Husanjot Chahal, Sara Abdulla, Jennifer Melot, Zach Arnold
- Engineering: Jennifer Melot
- Review and testing: Aaron Melville, Matt Sheehan, Andreas Kuehn, Kaishap Raibagi, Katherine Koleski, Michael Selitto, Ari Filler, Sriya Guduru, Alina Thai, Tisyaketu Sirkar, Patrick Wu, and anonymous testers
- Documentation: Zach Arnold, Husanjot Chahal, Sara Abdulla, Jennifer Melot, Katherine Quinn, Rebecca Gelles
- Maintenance: Jennifer Melot, Neha Singh, Brian Love, Rebecca Gelles, Shruti Agarwal
Major change log
| 10/06/25 | Major data update following MAC changes |
| 12/5/24 | Documentation updates after release of Country AI Activity Metrics and Cross-Border Tech Research Metrics datasets; no substantive changes to tool |
| 11/22/23 | Major data update following MAC changes |
| 10/19/22 | Updated version, including changes to available AI subfields |
| 8/18/22 | Initial release on CSET's website |