Overview
What is this tool?
ETO's Supply Chain Explorer tool visualizes supply chains in critical and emerging technology. This edition of the Explorer covers the tools, materials, processes, countries, and firms involved in producing advanced logic chips - computer chips that are critical to virtually every sector of the economy, from transportation and telecommunications to robotics, artificial intelligence, and biotechnology.
What can I use it for?
You can use the Explorer to:
- Learn about how advanced logic chips are produced and the tools, materials, and processes that are involved.
- Visually explore the chip supply chain as a series of stages and processes, each involving different tools, materials, and providers.
- Assess countries' and companies' roles in the supply chain using the dataset's extensive provider information.
- Identify "chokepoints," market concentration, dependency relationships, and other structural features of the supply chain.
Get updates
What are its most important limitations?
- It's high-level. The Explorer is designed to orient non-specialists to the supply chain for advanced chips. It may be less relevant to professional supply chain managers, regulatory compliance analysts, or other specialists requiring very granular data or analytic capabilities.
- Some data are out of date. As of July 2025, most of the supply chain segments represented in the dataset use 2024 market sizes and market shares. Some supply chain segments are out of date already (i.e., using 2019 data), and more will go stale over time. Read more >>
- The country market share and company nationality data rely on headquarters of the company's ultimate parent, making the tool less useful for research questions that depend on where production is physically happening. Read more >>
What are its sources?
This tool relies on ETO's Advanced Semiconductor Supply Chain Dataset.
Does it contain sensitive information, such as personally identifiable information?
No.
What are the terms of use?
The Explorer interface, its codebase, and the underlying dataset are subject to ETO's general terms of use. If you use any of these resources in your work, please cite us.
How do I cite it?
Please cite the "Emerging Technology Observatory Supply Chain Explorer: Advanced Chips," including the link.
Using the Explorer
How do I use it?
The basics
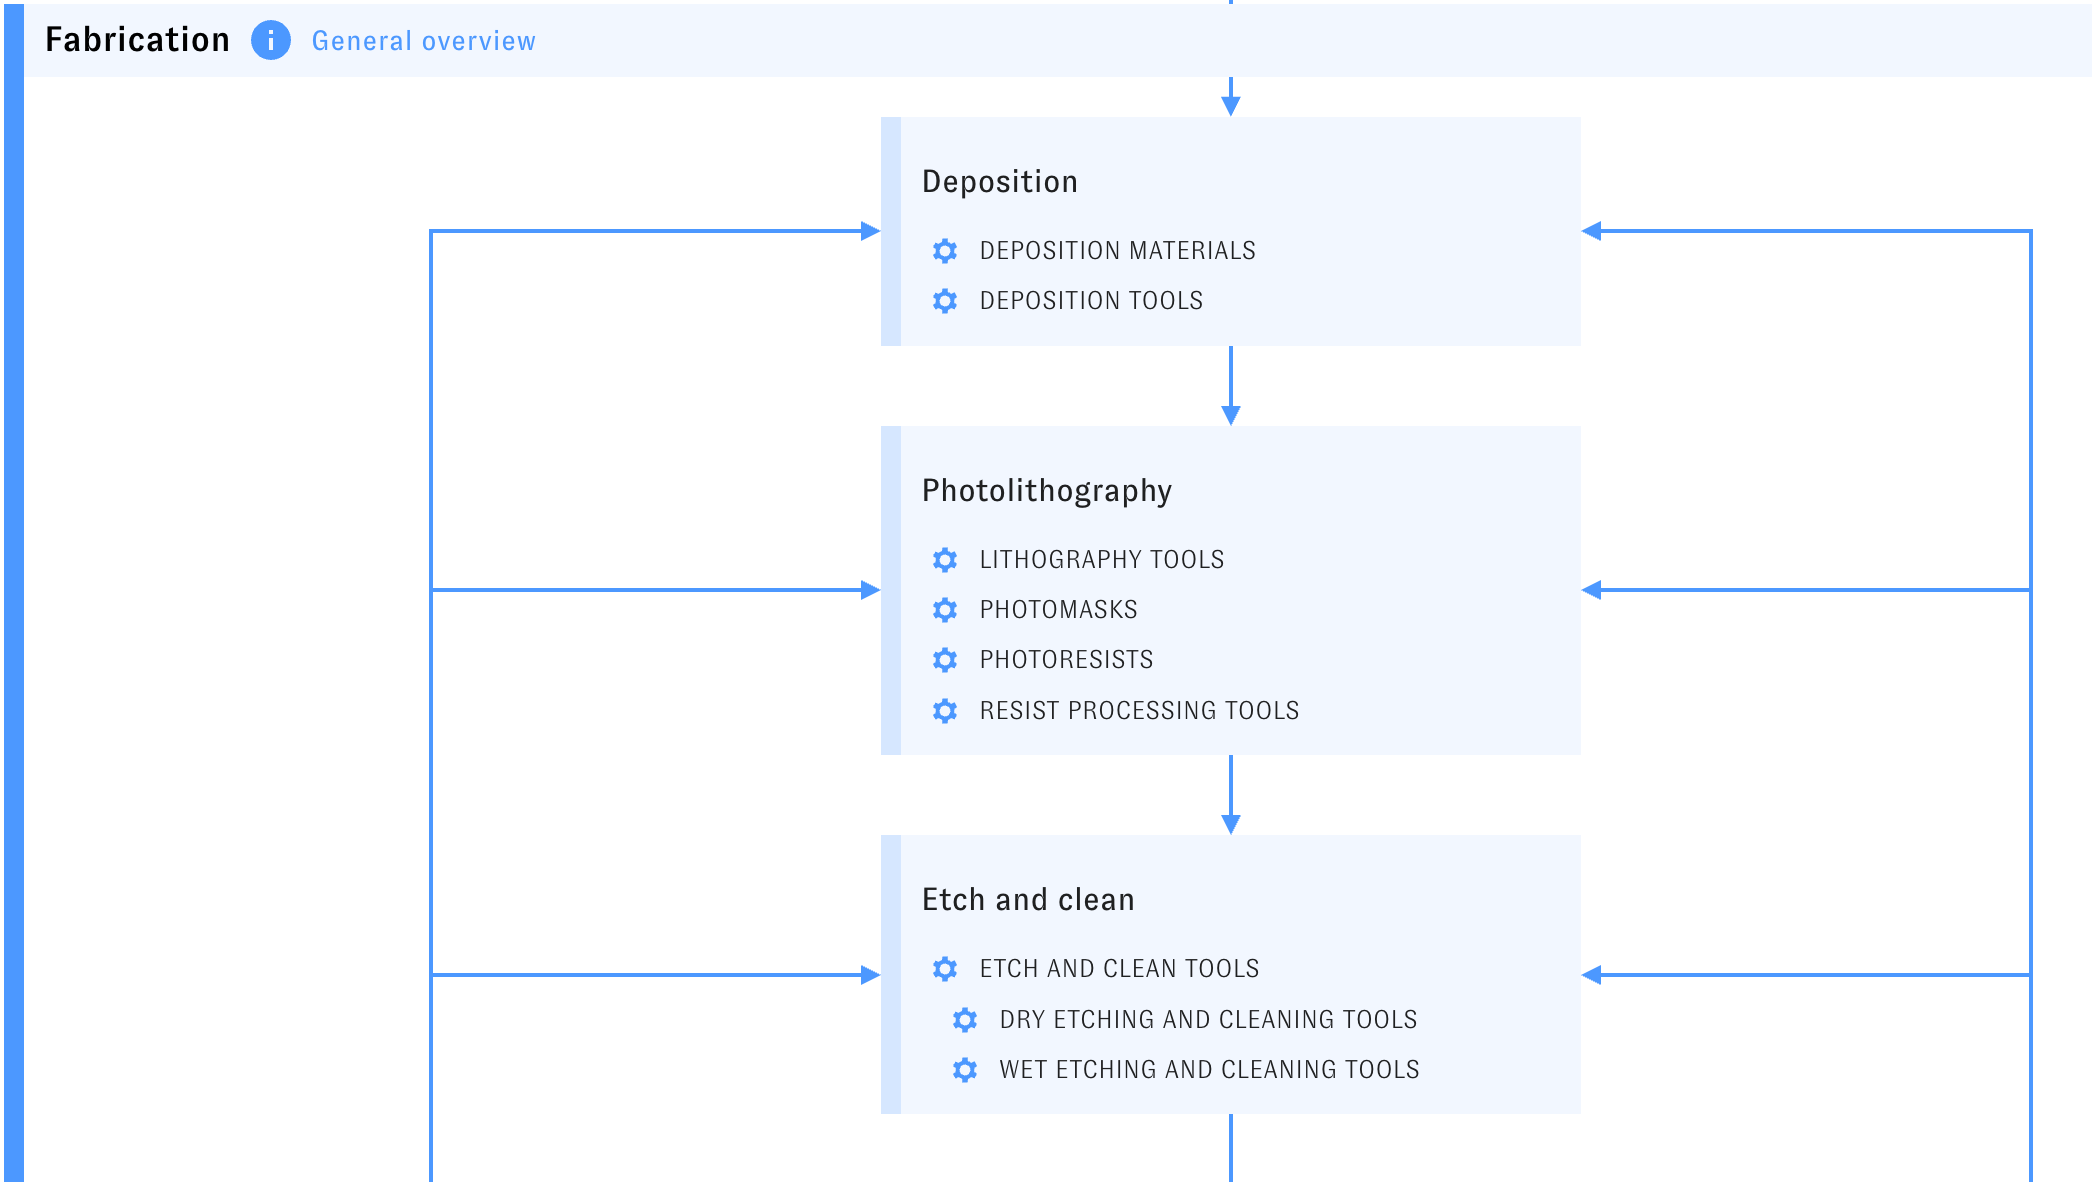
The Explorer visualizes the supply chain for advanced chips as a sequence of processes. Each process exists within a broader production stage and uses different kinds of inputs, which are listed under the name of each process. Inputs include consumable materials, like chemicals, and non-consumable tools, like machinery. (In this documentation, we sometimes refer to stages, processes, and inputs as "elements.")
Detail view
Clicking on a stage (using the information icon), process, or input will open a detail pane.
You'll see that some inputs have variants, which can be accessed through the detail pane for the parent input (or by selecting the variant with the "Specific inputs" highlighter). For example, there are many different types of deposition tools, some of which have variants of their own:
Highlighting
Use the Explorer's filter bar to choose and apply different highlighting to elements. To learn more about what the filters mean, hover over the "?" icons.
Only one filter can be used at a time. When you apply one, all of the matching elements will become highlighted, and the others will fade out. Clear the filters at any time with the "Clear" button.
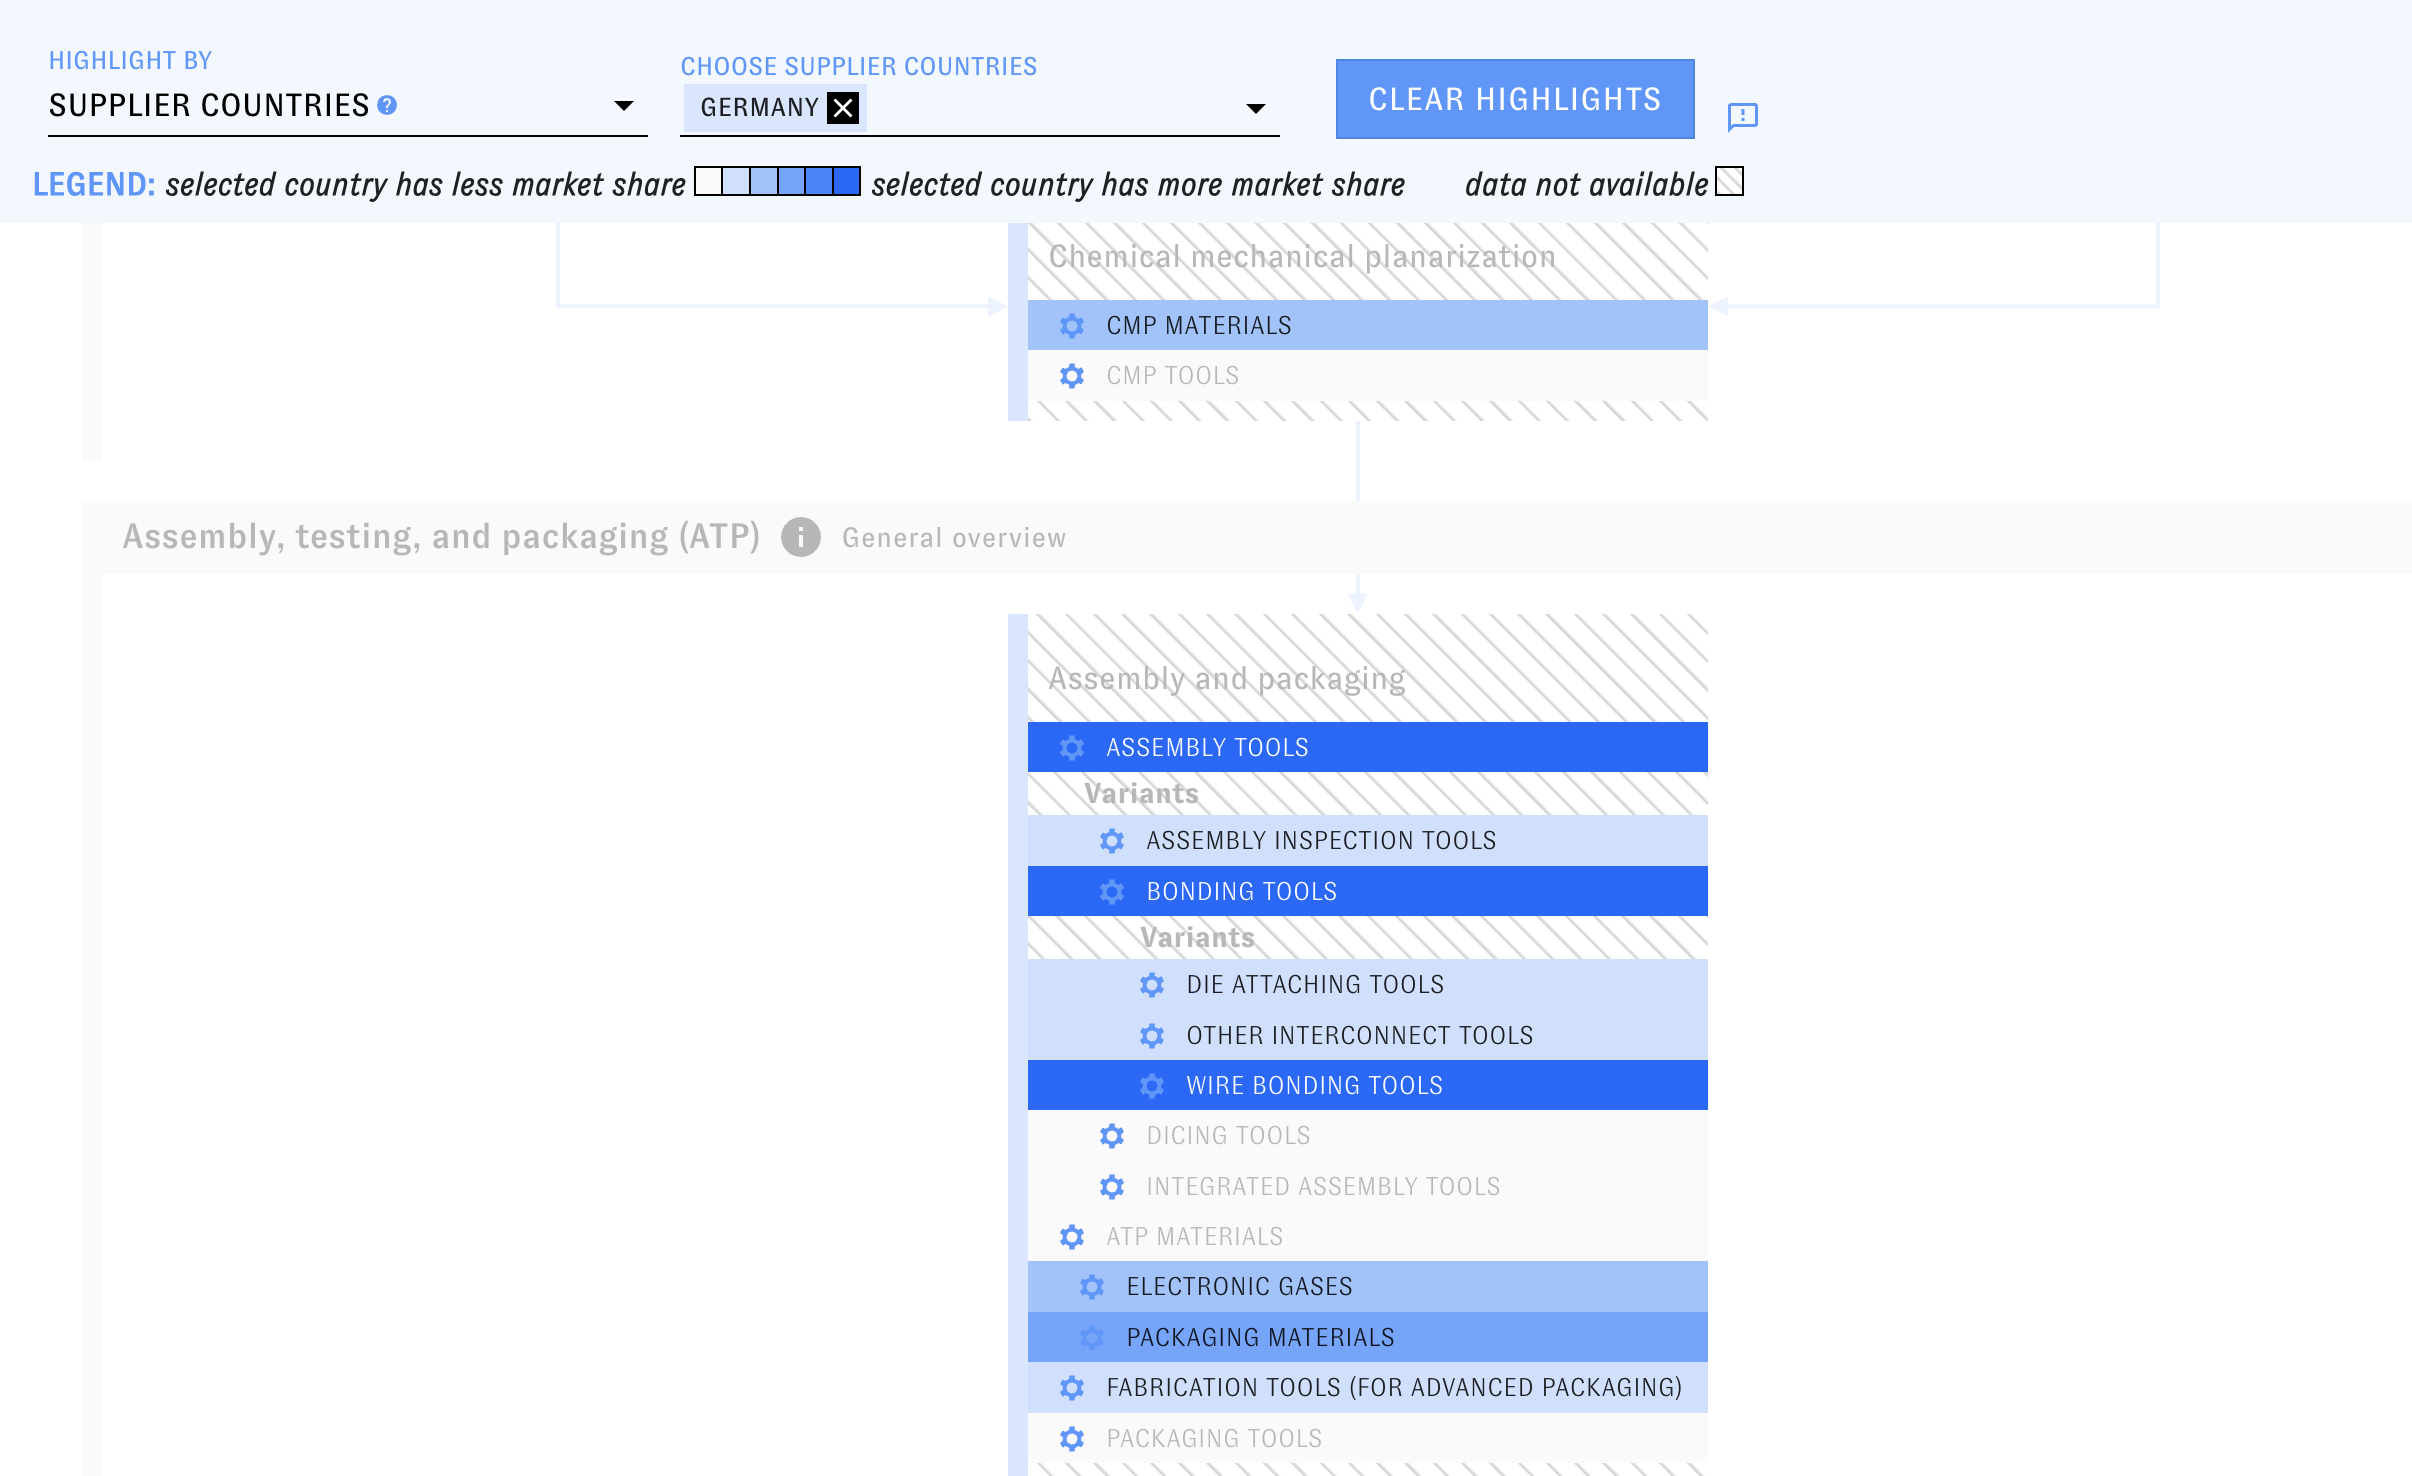
Some filters apply highlighting in different shades, representing different amounts or levels of intensity. For example, applying the country filter will highlight different areas of the map according to the country's market share in those areas (stronger highlighting for higher market share).
Coming back to a view
As you browse the Explorer, your browser's address bar will update to reflect the applied filters or selections. Copy the URL in order to return to the same view later.
What can I use it for?
Learn about the tools, materials, and processes used to produce advanced logic chips, and the countries and firms that provide them. You can use the Explorer to browse this information visually.
Sort and visualize elements of the supply chain according to provider countries, firms, and degree of concentration. Use the Explorer's filters to quickly identify interesting processes, tools, or materials, or dive deep into specific inputs using the detail view. For complex queries involving multiple criteria, you can also crunch the raw data with your favorite data analysis tools.
See what's downstream or upstream of a particular stage or process in the supply chain. You can see these relationships at a glance in the Explorer interface. (Advanced users can also calculate these relationships programmatically using the raw data.)
Which uses are not recommended?
- Tracking trends over time. This tool provides a "snapshot" view of the semiconductor supply chain. It doesn't include any historical data.
- Supply chain management uses, such as product sourcing, logistics management, or vetting vendors. The dataset used in this tool generally isn't specific or current enough for these applications.
- Measuring market scale, profitability, or other economic metrics related to the semiconductor sector. The dataset used in this tool doesn't include financial or economic data other than country market share for specific inputs.
- Researching individual firms in detail. This tool incorporates relatively high-level information about individual firms, such as headquarters location, website, and inputs provided. The underlying dataset includes some additional details, but neither resource has more granular company information, such as manufacturing capacity or location of specific facilities.
- Assessing the physical location of chip production. In this tool, country nationality is determined based on the headquarters of the company's ultimate parent, not (for example) where the company conducts most of its manufacturing or research. This also affects the calculation of country market share, and makes the Explorer less useful for research questions that turn on where chip production is actually happening. See the dataset documentation for further details.
- Uses that require highly up-to-date data. The dataset used in this tool contains 2024 market sizes and market shares for most inputs. We believe the data give a good overall picture of the global semiconductor supply chain, but some inputs use older data from 2019 or 2022.
Sources and methodology
Data sources
All of the data used in this tool comes from ETO's Advanced Semiconductor Supply Chain Dataset. This open-access dataset reflects CSET researchers' understanding of the supply chain for advanced chips as of July 2025 and draws on a variety of sources. Read more >>
Filter methodology
The Explorer includes three different filters (plus the "Specific Inputs" filter, which takes you directly to details for the selected tool or material). These filters apply highlighting to stages and inputs, but not processes (which will be faded out whenever a filter is active). Here's how they work:
- The Supplier Countries filter highlights stages and inputs according to the cumulative market share of the selected country or countries. (A country's market share is equal to the total market share of companies headquartered in that country.) There are six different shades of highlighting:
- When quantitative market share data is available for an element, the shades correspond to 0% cumulative market share, 1-20%, 21-40%, 41-60%, 61-80%, and 81-100%.
- When quantitative market share data is not available for an element, a medium shade is applied if a selected country is a supplier; the shade will darken if multiple selected countries are suppliers.
- The Supplier Companies filter is a binary filter that highlights stages and elements supplied (to any extent) by the selected company, or (if more than one company is selected) by any one of the selected companies.
- The Market Concentration filter highlights stages and inputs according to how many countries supply them. There are three different shades of highlighting:
- The darkest shade is applied if suppliers in a single country control more than 75% of the total market.
- Otherwise, a medium shade is applied if suppliers in three or fewer countries control 75% of the total market.
- Otherwise, no shading is applied.
Maintenance
How is it updated?
The Explorer is currently considered stable. Depending on user feedback, we may fix bugs or add new features to the interface from time to time, but no major upgrades are currently planned. However, we do plan to periodically update the data used in the interface. Read more >>
How can I report an issue?
Use our general issue reporting form, or click on the "Submit feedback" icons embedded in the tool to report issues related to specific data points.
Credits
The dataset in the Explorer is largely derived by CSET analysts from the TechInsights Chip Market Research Services (CMRS) Semiconductor Equipment Database (May 2025 release). The dataset also incorporates data published by World Semiconductor Trade Statistics (WSTS) and the Semiconductor Industry Association (SIA), among other sources.
Prior releases of the dataset drew on data from Saif M. Khan, Alexander Mann, and Dahlia Peterson, The Semiconductor Supply Chain: Assessing National Competitiveness (Center for Security and Emerging Technology, January 2021).
Additional support came from:
- Concept: Zach Arnold, John VerWey
- Design and engineering: Jennifer Melot, Zach Arnold, Neha Singh, Brian Love
- Review and testing: John VerWey, Kevin McGinnis, Micah Musser, Sriya Guduru, Tisyaketu Sirkar, Alina Thai, Vrushank Vora, Patrick Wu, Melissa Hopkins, Ari Filler, Jacob Feldgoise, Hanna Dohmen, and anonymous testers
- Documentation: Zach Arnold, Adrian Thinnyun, Jacob Feldgoise
- Special thanks: Saif Khan
View the dataset documentation for more acknowledgments.
Major change log
| 7/14/25 | July 2025 update: added company-level market shares, updated most data from 2019 to 2024, revised input taxonomy, and updated country affiliations. |
| 10/19/22 | Initial release |