Overview
What is this tool?
PARAT (Private-Sector AI-Related Activity Tracker) is ETO's hub for data on private-sector companies and their AI activities. PARAT's easy-to-use interface brings together data on companies' AI research publications, patents, and hiring, enabling customizable, data-driven comparison and trend analysis. Use PARAT to browse AI activity indicators for hundreds of leading companies around the world, from Big Tech titans and leading generative AI startups to the entire S&P 500.
What can I use it for?
Use PARAT to:
- Access in-depth data on individual companies and their work in AI. PARAT includes diverse AI activity indicators for each company, with many broken out by time period and subtopic.
- See how companies compare across PARAT's indicators of AI activity. Compare companies to each other or to broader groups like the S&P 500.
- Customize your analysis of the private-sector AI ecosystem. Set your own filters and thresholds with PARAT's easy-to-use interface, pinpointing the companies and trends that matter most to you.
- Track AI trends across different countries and industries. Use PARAT to explore how AI activity varies from sector to sector or in different countries.
Get updates
What are its most important limitations?
-
PARAT doesn't cover all AI-related companies, and the sample it does cover isn't necessarily representative of all global activity in AI. The companies currently included in PARAT represent a wide range of industries, sizes, countries and levels of AI activity. Some important groups of companies are covered in full (such as the S&P 500 and those companies typically considered part of "Big Tech"). Overall, though, the companies covered in PARAT represent only a slice of the global AI landscape.
-
PARAT doesn't include every important indicator of AI-related activity. PARAT uses publications, patents, and AI-related jobs to capture different dimensions of AI-related activity. There are many other ways to capture AI-related activity that are not included in the tool.
-
PARAT isn't a comprehensive ranking system. Because PARAT only includes select companies and indicators of AI activity, it shouldn't be used on its own to draw sweeping conclusions about companies' AI capabilities - or to rank companies against each other in AI overall. Use PARAT together with other data sources to better understand how companies are active in AI and how they might "stack up."
-
PARAT relies on publicly available data that may not fully capture relevant activity. Data on companies' publications, patents, and job postings are imperfect proxies for AI-related research, invention, and hiring. PARAT's workforce data is particularly incomplete for non-U.S. companies. In addition, the patent and publication data PARAT uses have important limitations and lags; the lags particularly affect companies that are new or that have recently begun publishing or patenting more. These limitations are discussed in detail in the data documentation.
What are its sources?
PARAT uses Private-Sector AI Indicators dataset. Read more >>
Does it contain sensitive information, such as personally identifiable information?
No.
What are the terms of use?
The PARAT tool and metrics are subject to ETO's general terms of use. If you use the tool, please cite us.
How do I cite it?
If you use data from PARAT in your work, please cite "Emerging Technology Observatory PARAT" and include the link to the tool.
Using PARAT
How do I use it?
Browsing and filtering companies
PARAT's main view consists of a customizable table of companies with selected data related to their AI publications, patents, and workforce. Use the menus and sliders in each column's header to filter the table down to companies meeting particular conditions, such as a specific country or publication count.
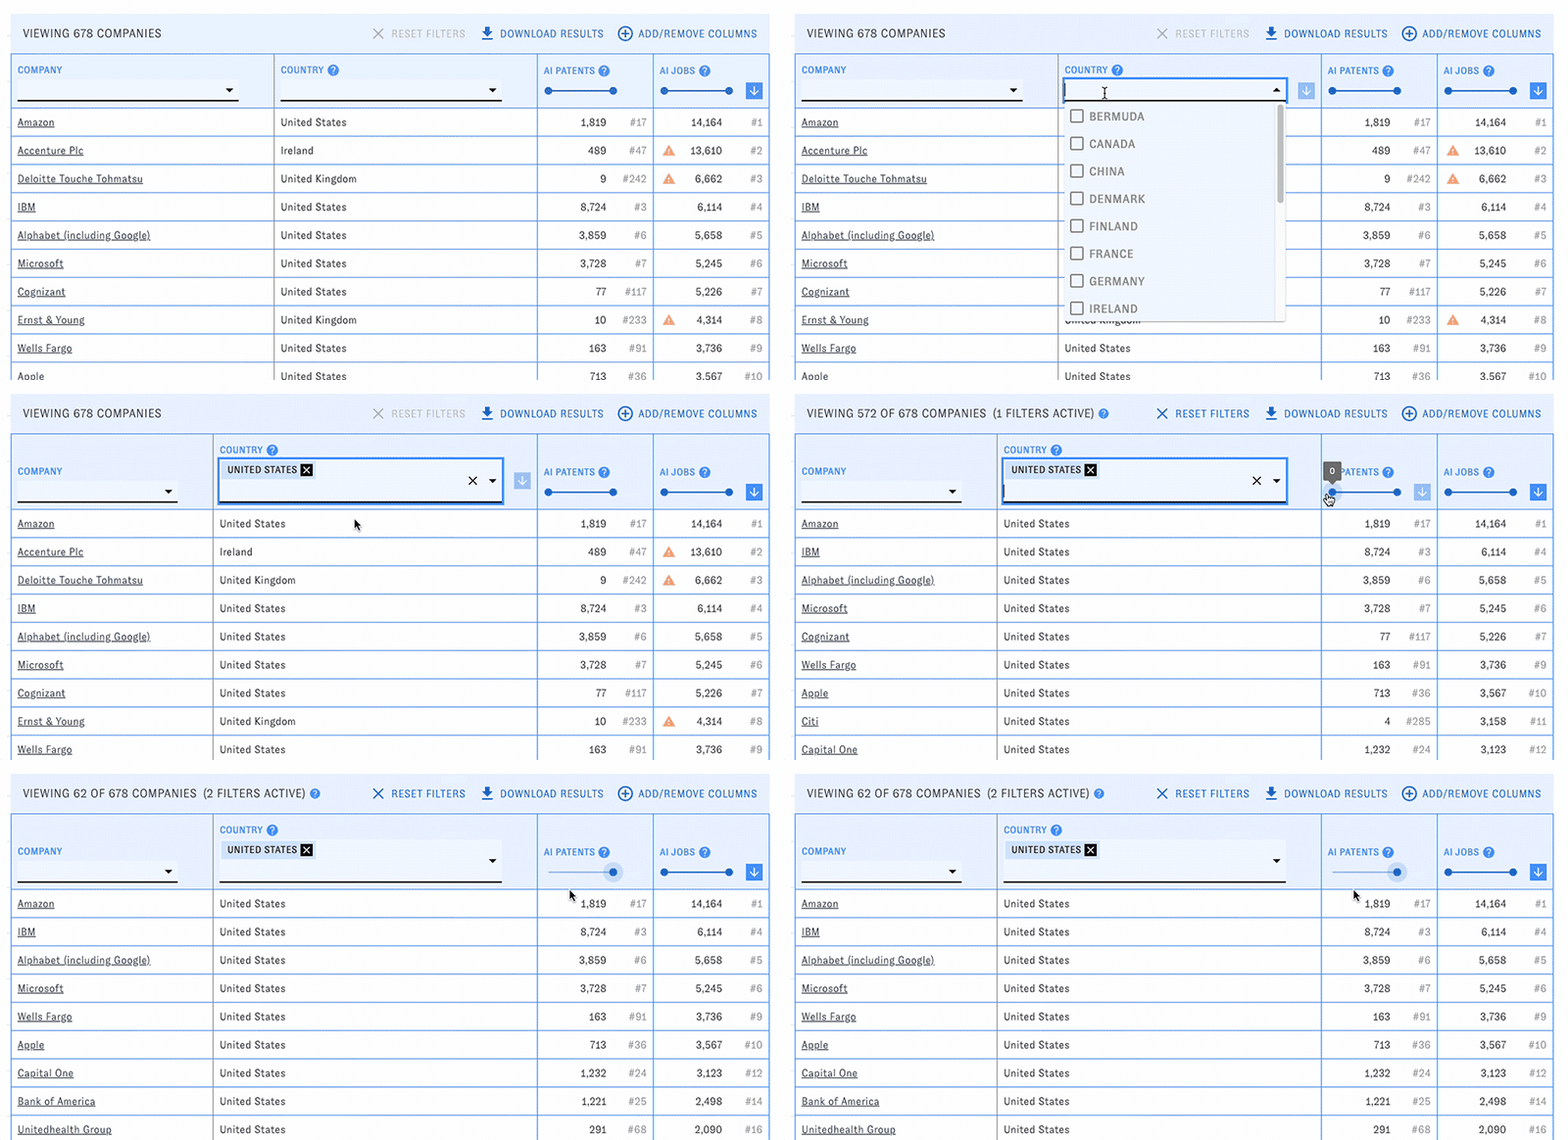
You can change the types of data displayed in the table with the "Add/Remove Columns" button. Here and elsewhere, hovering over the question mark icons will display help text. Click on the blue arrow boxes to sort the table by different columns in ascending or descending order.
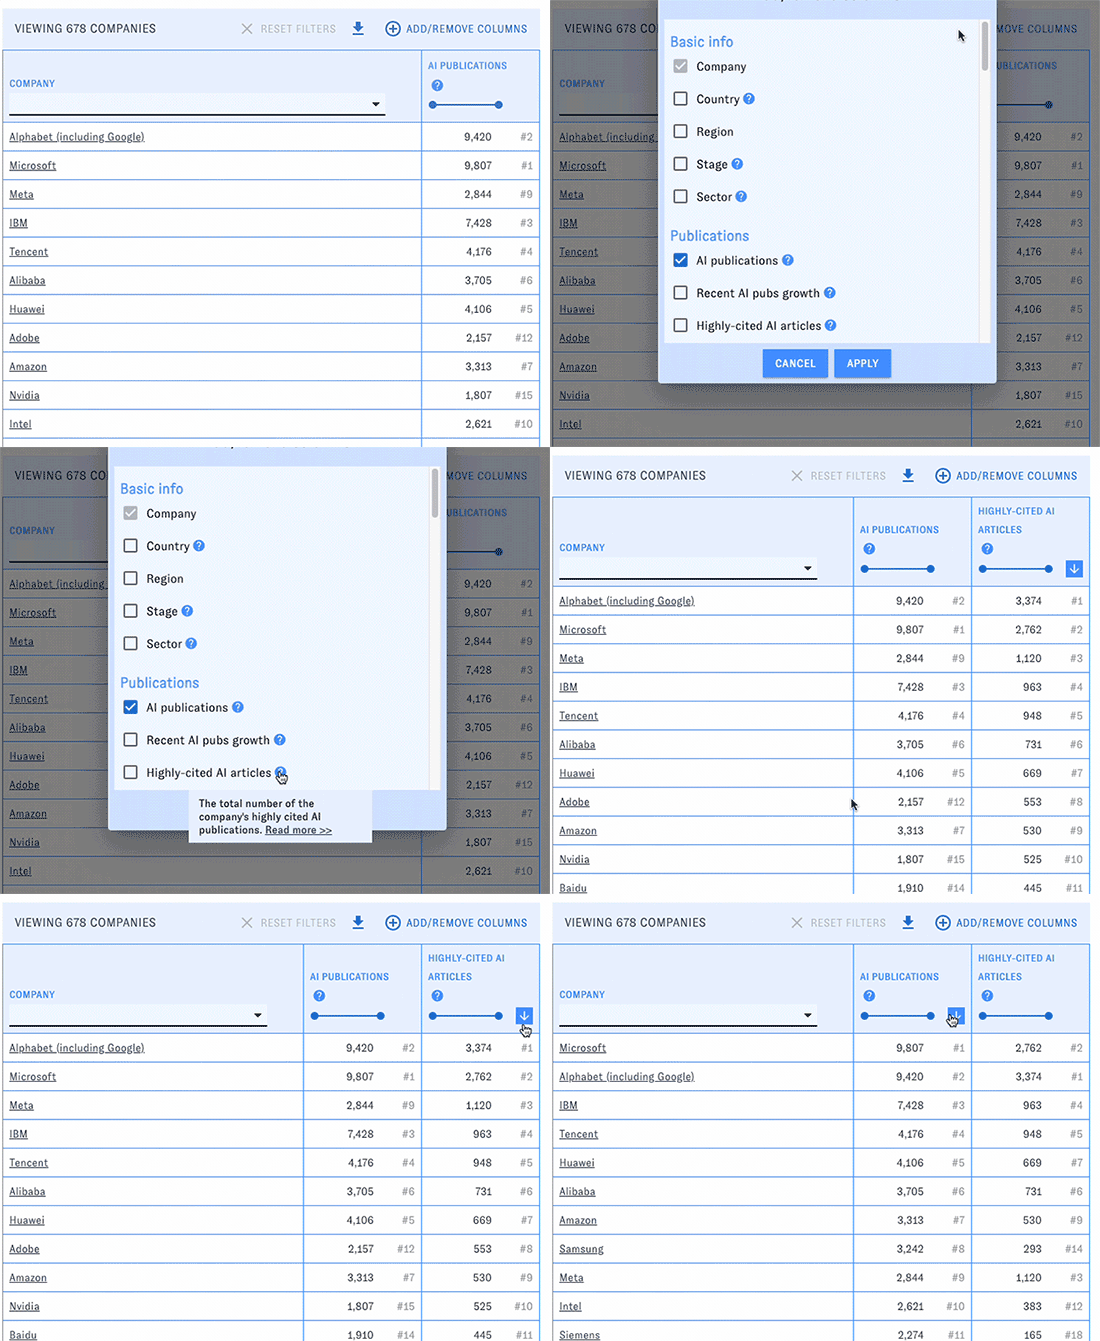
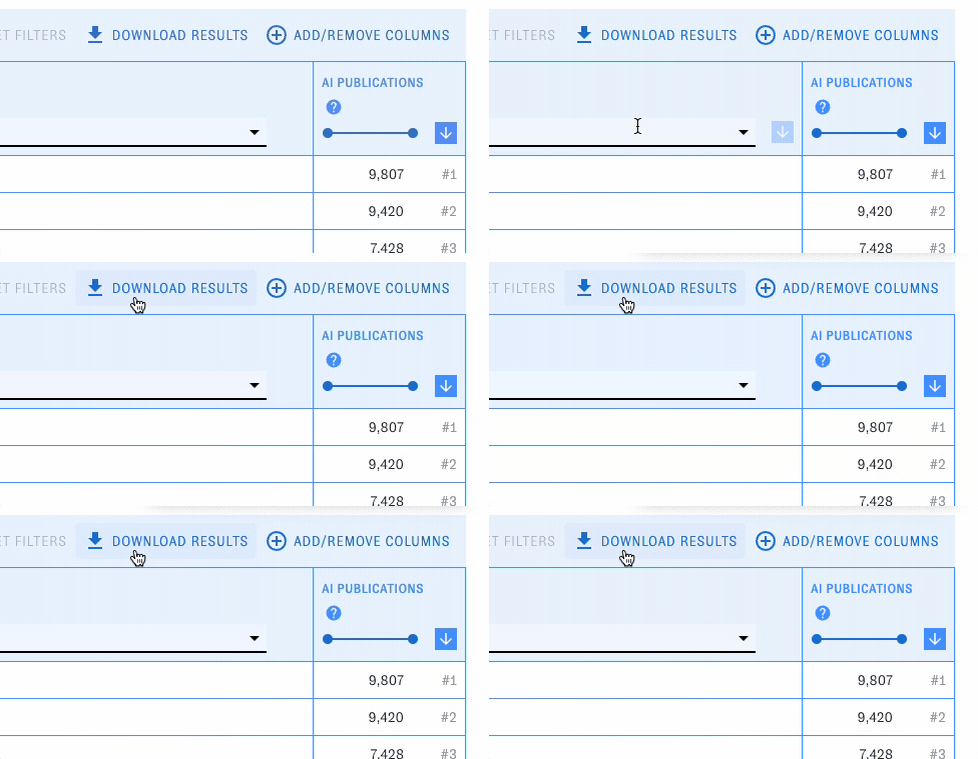
At any time, click the "Download results" button to download the table (including current filters, sorts, and visible columns) in csv format.
Using company groups
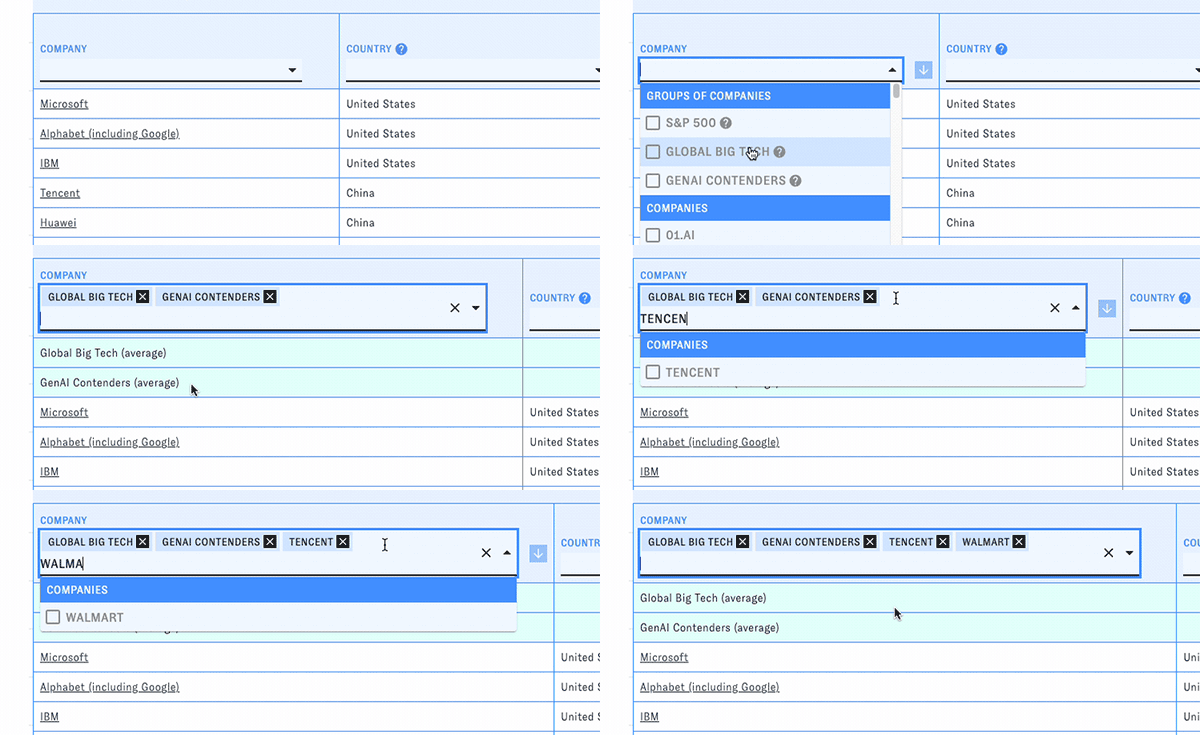
PARAT includes curated groups of companies for quick analysis and comparison, such as the S&P 500 and notable generative AI companies. Open the "Company" dropdown to access them. When you pick one, all of the companies in that group will be listed in the table, along with an aggregate row displaying summary statistics for the whole group.
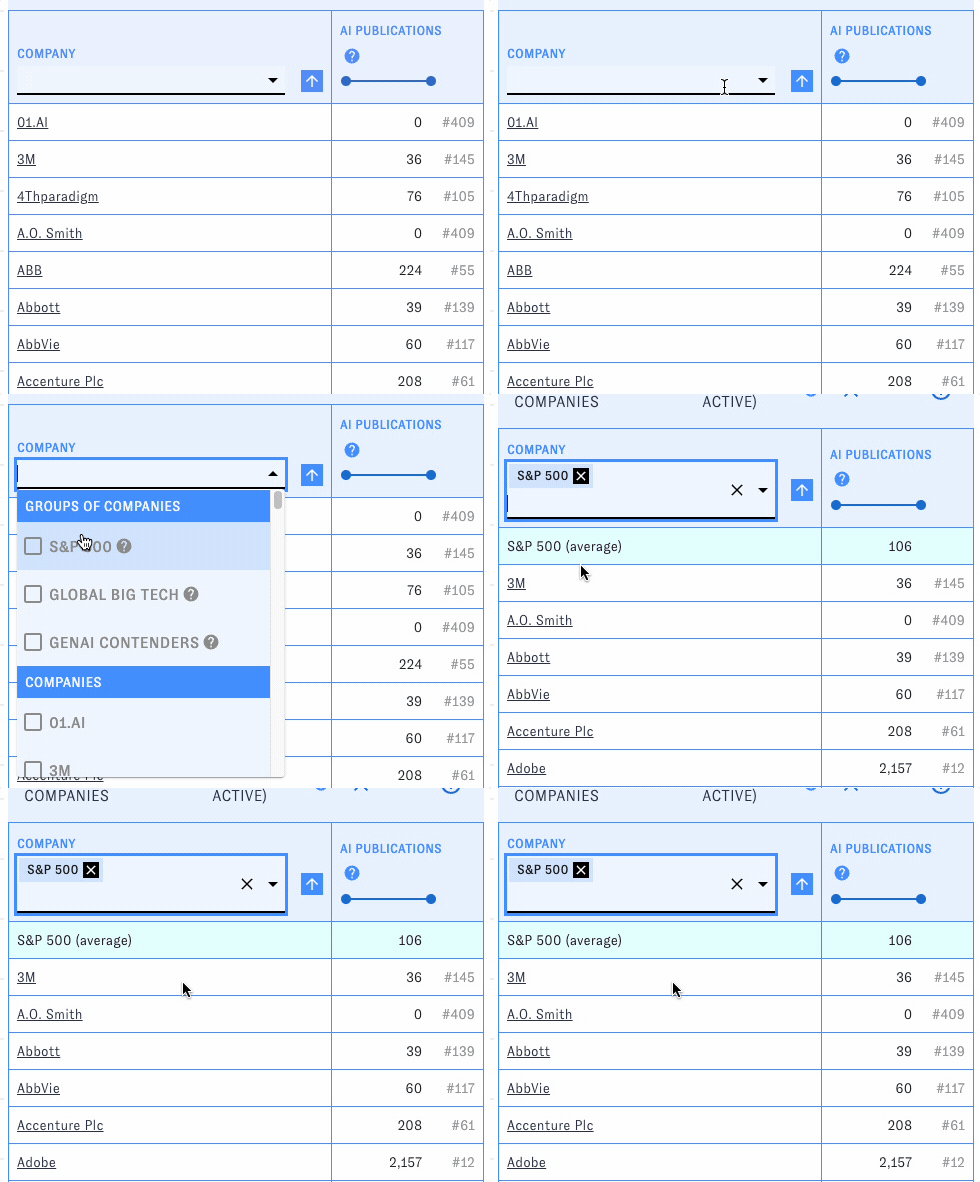
You can look at multiple groups at the same time or mix groups and individual companies in the table.
Viewing details about a single company
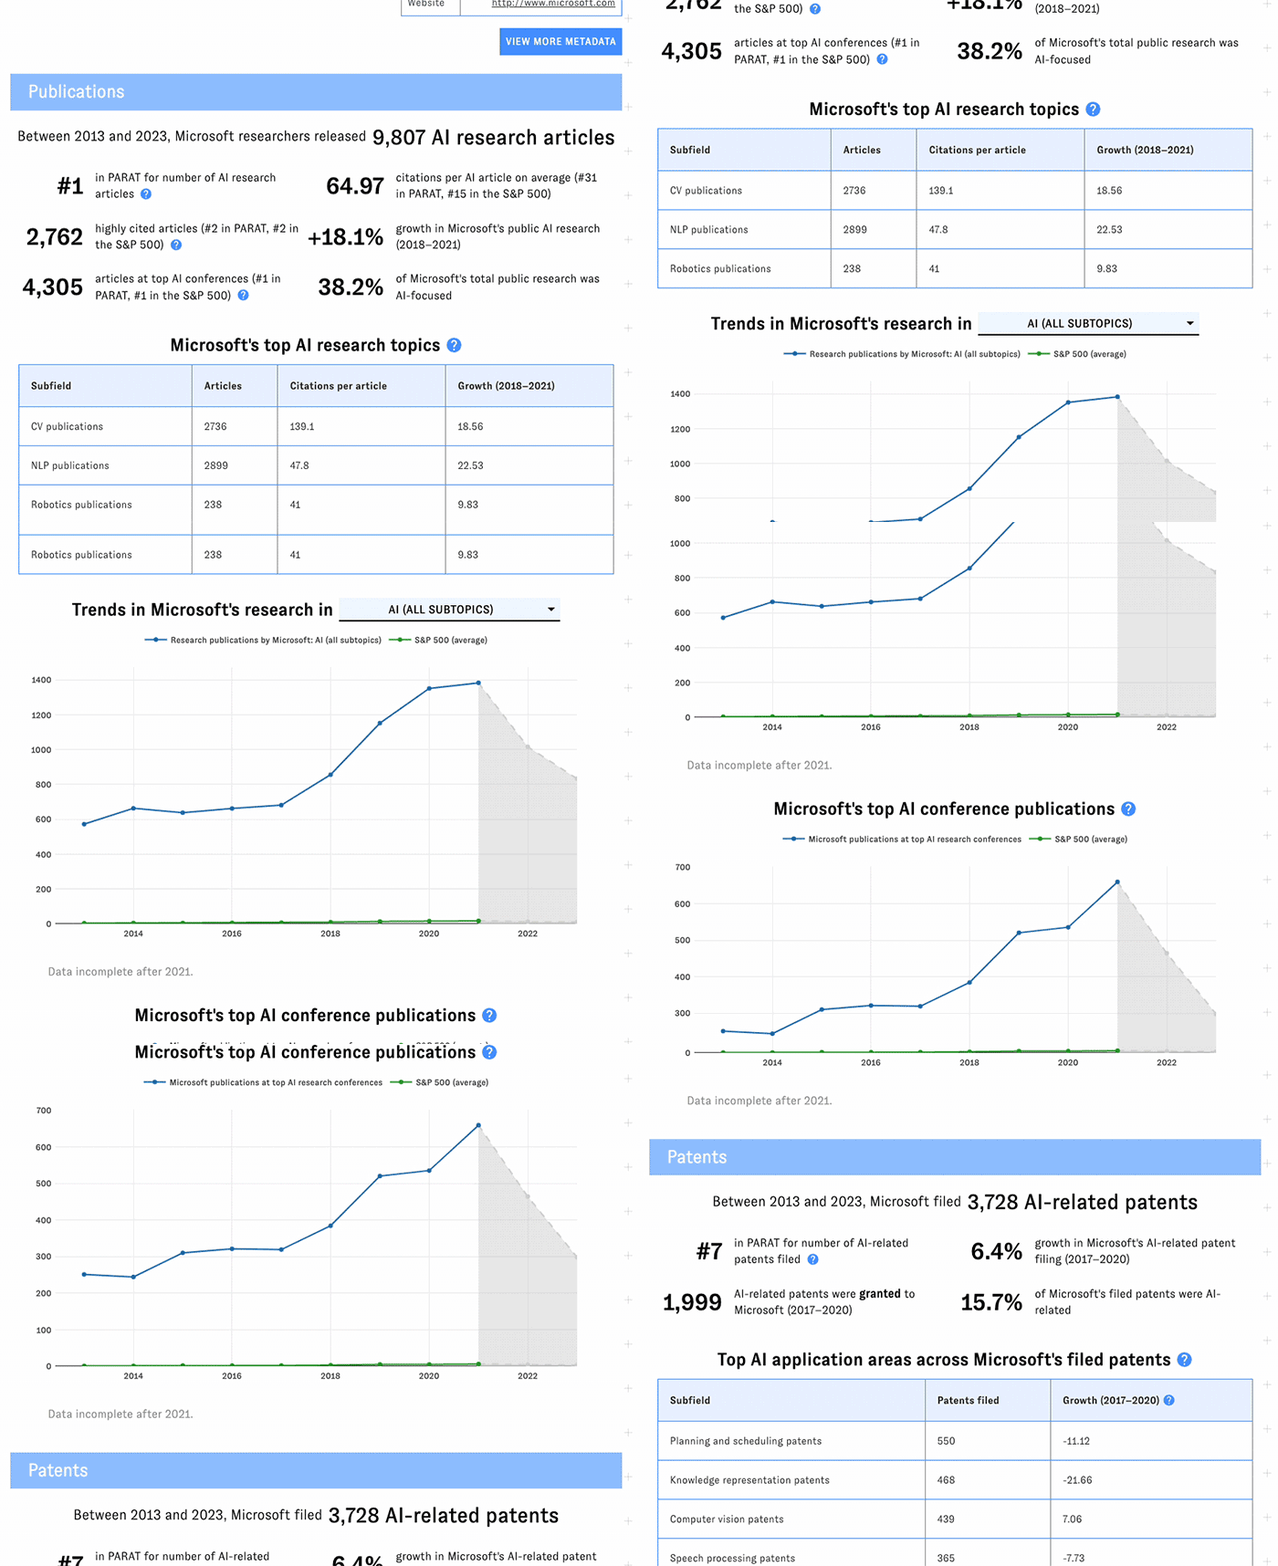
Click on a company's name to launch its detail page, featuring key facts, trendlines, and additional metrics not available in the main table.
Coming back to a view
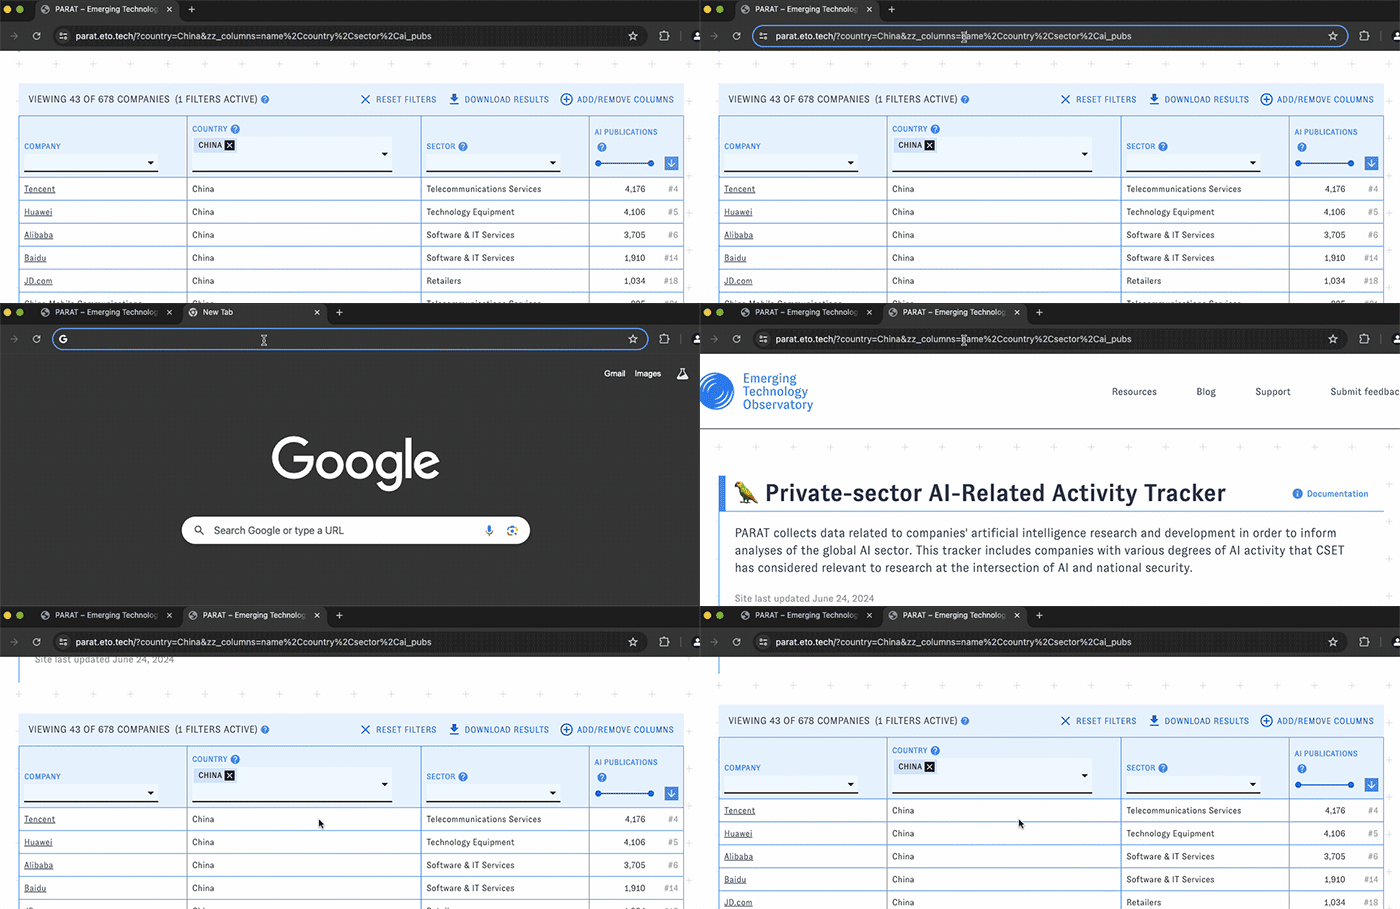
As you work with PARAT, your browser's address bar will update to reflect the applied filters and selections. Copy the URL in order to return to the same view later.
What can I use it for?
Access in-depth data on individual companies and their work in AI. PARAT includes diverse AI activity indicators for each company, with many broken out by time period and subtopic.
See how companies stack up across PARAT's indicators of AI activity. Compare companies to each other, or to broader groups like the S&P 500, on the specific AI activity indicators PARAT covers. (But interpret these comparisons with caution!)
- Which S&P 500 companies are filing the most AI-related patents? What about within specific S&P 500 sectors, like finance or pharmaceuticals?
- Which PARAT companies employ the most tech workers? Which have the most publications in top AI conferences?
- What are some "blue chip" firms with as many or more AI workers than the big tech companies?
Customize your analysis of the private-sector AI ecosystem. Set your own filters and thresholds with PARAT's easy-to-use interface, pinpointing the companies and trends that matter most to you.
Track AI trends across different industries. Use PARAT to explore how AI activity varies from sector to sector within the S&P 500.
Which uses are not recommended?
-
Drawing firm conclusions about companies' AI capabilities, or treating PARAT as a comprehensive ranking system. How a company "scores" on different PARAT metrics can be considered illustrative of that company's AI capabilities. But PARAT, on its own, can't tell you how innovative or capable a company is in AI overall, or whether it's more or less innovative or capable than another company on the whole. The tool simply doesn't cover all of the metrics and companies that would be needed to draw sweeping conclusions about which companies are ahead of others in AI, and it doesn't make judgments about whether some metrics are more important than others.
-
Analyzing all of the companies in PARAT as a group. PARAT includes companies identified using a variety of methods with different motivations. In other words, the companies in PARAT aren't necessarily comprehensive or even representative of the AI industry - or anything else. For this reason, statements like "The average number of AI patents across PARAT companies is X," "Company Y has more AI publications than Z% of PARAT companies," or "Very few PARAT companies are based in South America" should be avoided. If you want to analyze or draw comparisons using groups of companies, use PARAT's built-in company groups instead.
-
Identifying "AI companies" or "non-AI companies." There are many ways to define "AI companies," because there are many ways companies might be active in AI. PARAT doesn't cover all of these ways. Also, the companies it includes aren't necessarily comprehensive or representative of the AI industry. For these reasons, the fact that Company X is in PARAT, or has a given "score" on a particular PARAT metric, doesn't necessarily mean that Company X is an "AI company." And if Company Y has lower "scores," or isn't in PARAT at all, that doesn't necessarily mean Company Y isn't an "AI company."
-
Drawing precise conclusions about AI workforce trends outside the United States. PARAT's workforce metrics are derived from LinkedIn data. LinkedIn is less popular in many countries than it is in the United States - and is blocked in other countries, including China and Russia. (A local version of LinkedIn was available in China from 2021 to 2023; data from that period is included in PARAT.) Workforce data involving companies outside the U.S. should be used with extreme caution.
Sources and methodology
PARAT runs on ETO's Private-Sector AI Indicators dataset, which includes a diverse range of indicators of AI-related activity for hundreds of companies worldwide, from startups to multinationals. The dataset uses our original metadata, models, and methods to transform information from a wide variety of data sources into AI-related research, patenting, and hiring metrics for every company covered in PARAT. Visit the dataset's documentation to learn more about this dataset and how it's maintained.
Maintenance
How is it updated?
PARAT updates automatically when the Private-Sector AI Indicators dataset updates - typically monthly.
Workforce data are not currently updating as we implement changes to the underlying data feeds. The workforce data included in the current version of PARAT were last updated in late 2024. As we work to resume updates, feel free to contact us with any questions.
How can I report an issue?
Use our general issue reporting form.
Credits
- Concept: Rebecca Gelles, Ngor Luong, Zach Arnold
- Design and analysis: Zach Arnold, Brian Love, Ngor Luong, Rebecca Gelles
- Engineering: Brian Love, Jennifer Melot, Rebecca Gelles
- Review and testing: Sonali Pednekar, Nikita Pardeshi, Yudi Chen, Tianyi Xu, Vinayak Kannan, Jessie Dietz, Konstantin Pilz, Ciel Qi, Sonali Subbu Rathinam
- Documentation: Zach Arnold, Rebecca Gelles
- Maintenance: Jennifer Melot, Brian Love, Rebecca Gelles, Shruti Agarwal
We gratefully acknowledge contributions to earlier versions of PARAT from Catherine Aiken, Bethany Allen-Ebrahimian, Ryan Fedasiuk, Shelton Fitch, Alex Friedland, Daniel Hague, Igor Mikolic-Torreira, Dewey Murdick, Jordan Schneider, Adrienne Thompson, Lynne Weil, Ben Murphy, Yanqi Ding, and VISTA Consulting, LLC.
The AI activity metrics in the Private-Sector AI Indicators dataset are derived from data from Revelio Labs and other leading sources. Additional descriptive metadata in PARAT comes from the Crunchbase Open Data Map and PermID.
Major change log
| 10/06/25 | Major data update following MAC changes |
| 6/26/24 | Initial release |