
🔔 Attention Substack users! ETO blog posts are also available on Substack.
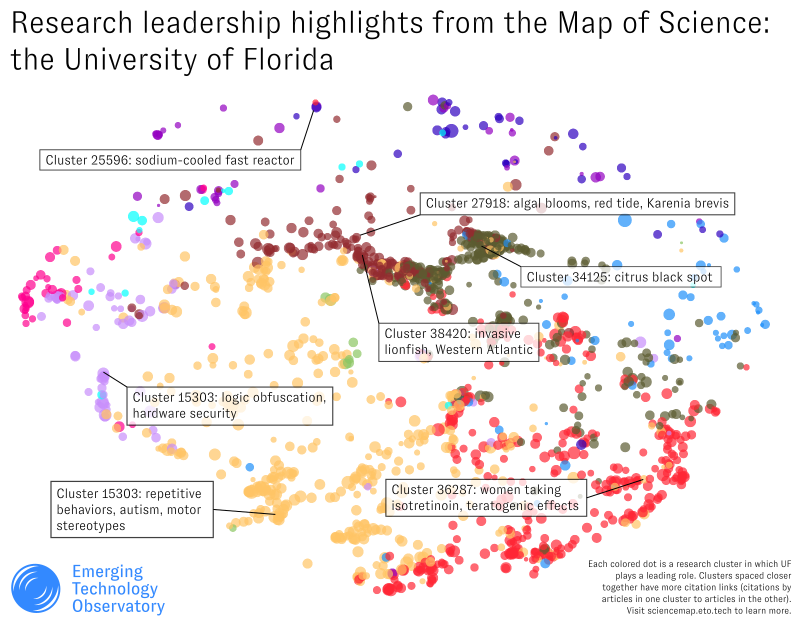
Our last post used the Map of Science to explore research leadership of a diverse range of American universities and their contributions to global science and tech. Using the Map's new author organization filter, we pinpointed research clusters in which different American schools play a leading role, like the University of Florida:
In this post, we'll share similar snapshots of some of Europe's leading research universities. As in the previous post, the approach we demonstrate here - using the free, public Map of Science interface - can be used by researchers and administrators to understand their own institutions' portfolios, by funders and policymakers to identify institutions especially relevant to different research topics, and by anyone else needing to understand the activity of different players in science and tech.
Today, for example, I'll imagine I'm a European science policymaker aiming to get a better sense of the research ecosystem I help support. Maybe I'm sitting in Brussels - I'll start locally, using the Map of Science to quickly visualize the research leadership of KU Leuven, a major research university located nearby:
At a glance, we see that KU Leuven plays a leading role in many research clusters (over a thousand!) across a wide range of subjects. We can get a feel for what these clusters are “about” by hovering over them, which brings up details and key concepts in the right-hand sidebar:
Examining individual clusters anywhere in KU Leuven's map (using the mouseover previews or cluster detail view) allows us to identify specific areas of research where the university has a leading presence. A few subjectively chosen highlights from our own browsing:
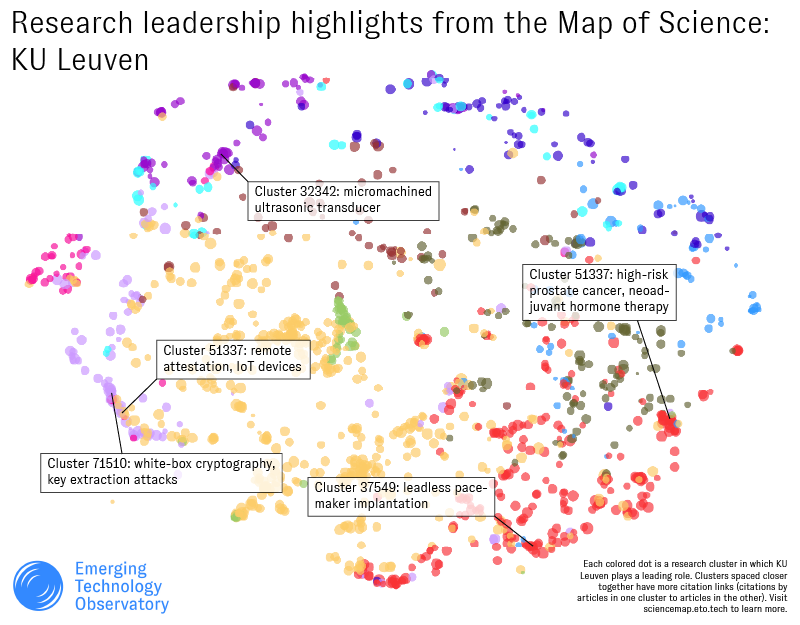
It's worth emphasizing that these are the areas of research where Leuven leads in our data, which is different from the areas where it is active. In other words, Leuven may have active research programs in areas not highlighted on this map, simply because other schools have even more activity in those areas.
Still, understanding where Leuven leads can help understand the school's unique strengths and specialties. To illustrate this, let's try focusing on a specific part of Leuven's portfolio. Filtering its leadership map to computer science shows a dense group of research clusters at the bottom right. To investigate, we can switch to list view and browse these clusters by their key concepts or other metrics.
By default, the Map's list view displays clusters in order of size. We can see that many of the biggest clusters where KU Leuven plays a leading role involve concepts from cryptography and cybersecurity, such as encryption, ciphers, and side-channel attacks. This strongly suggests Leuven has a specialty in these areas (some quick Googling confirms the point).
The Map's detail view reveals more about the particular cryptography areas where Leuven researchers lead. Using detail view, I can browse descriptive information about these areas - for example, how fast they're growing, which other research and funding institutions are prominent, or whether there are any related patents or open-source software repositories. Detail view will also show me key articles in each area, with links to further information in external sources such as arXiv or Web of Science (where available).
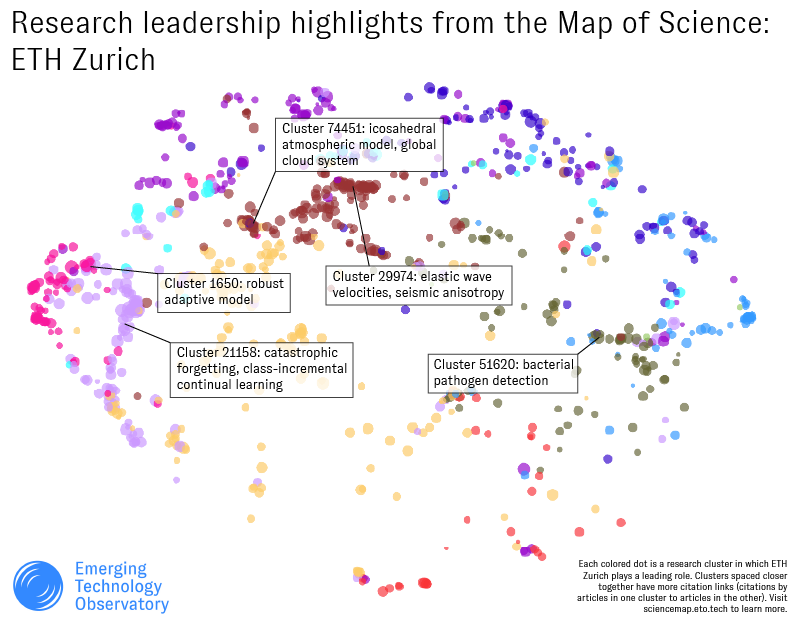
To learn more about the research landscape in which Leuven is situated, and the university's relative strengths, we can compare its leadership map to other notable institutions in neighboring countries. Here's the map for ETH Zurich in Switzerland:
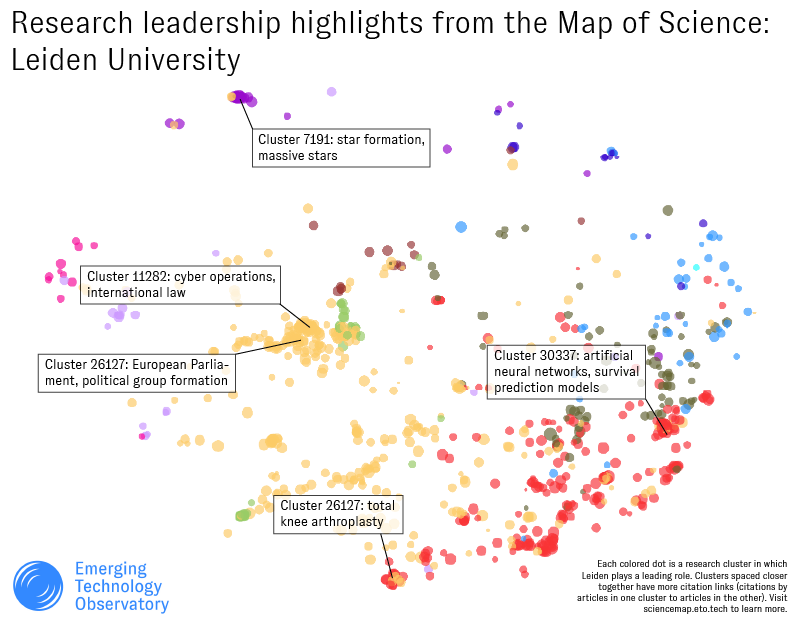
Leiden University, in the Netherlands:
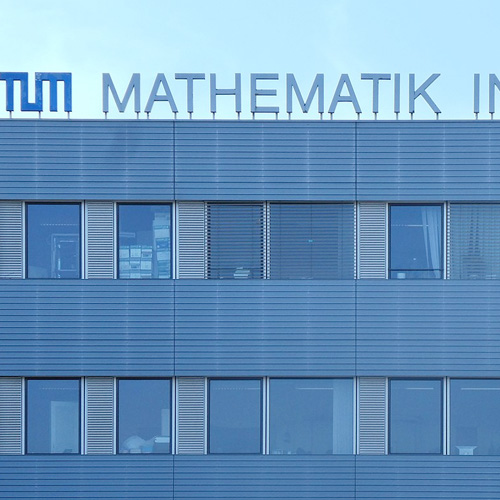
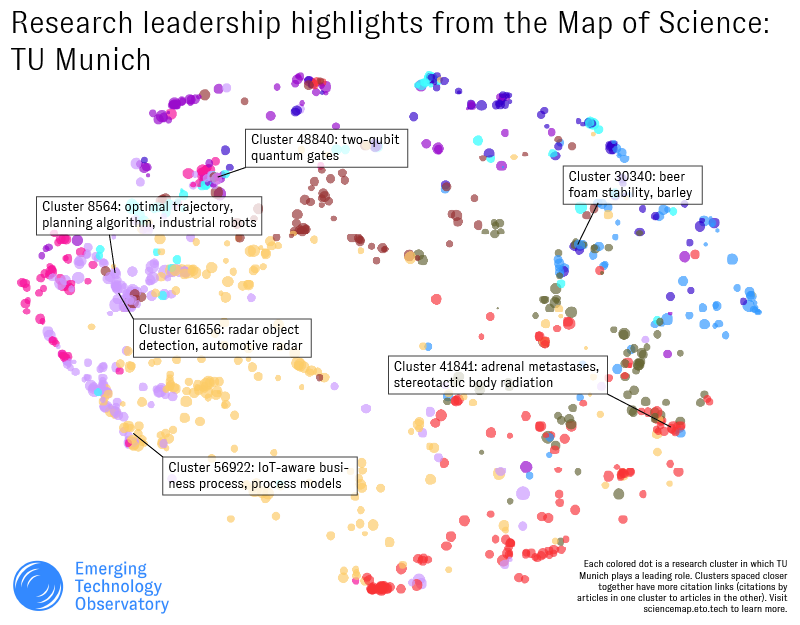
And TU Munich in Germany.
Side by side, we can see some interesting divergences among these universities. Leuven's map is perhaps the most evenly distributed across different subject areas (represented by different colors). Compared to ETH Zurich, for example, Leuven seems to have somewhat less of a leading role in computer science (lavender), math (magenta), and earth sciences (brown), but more of a leading role in the social sciences (yellow) and red (medicine).
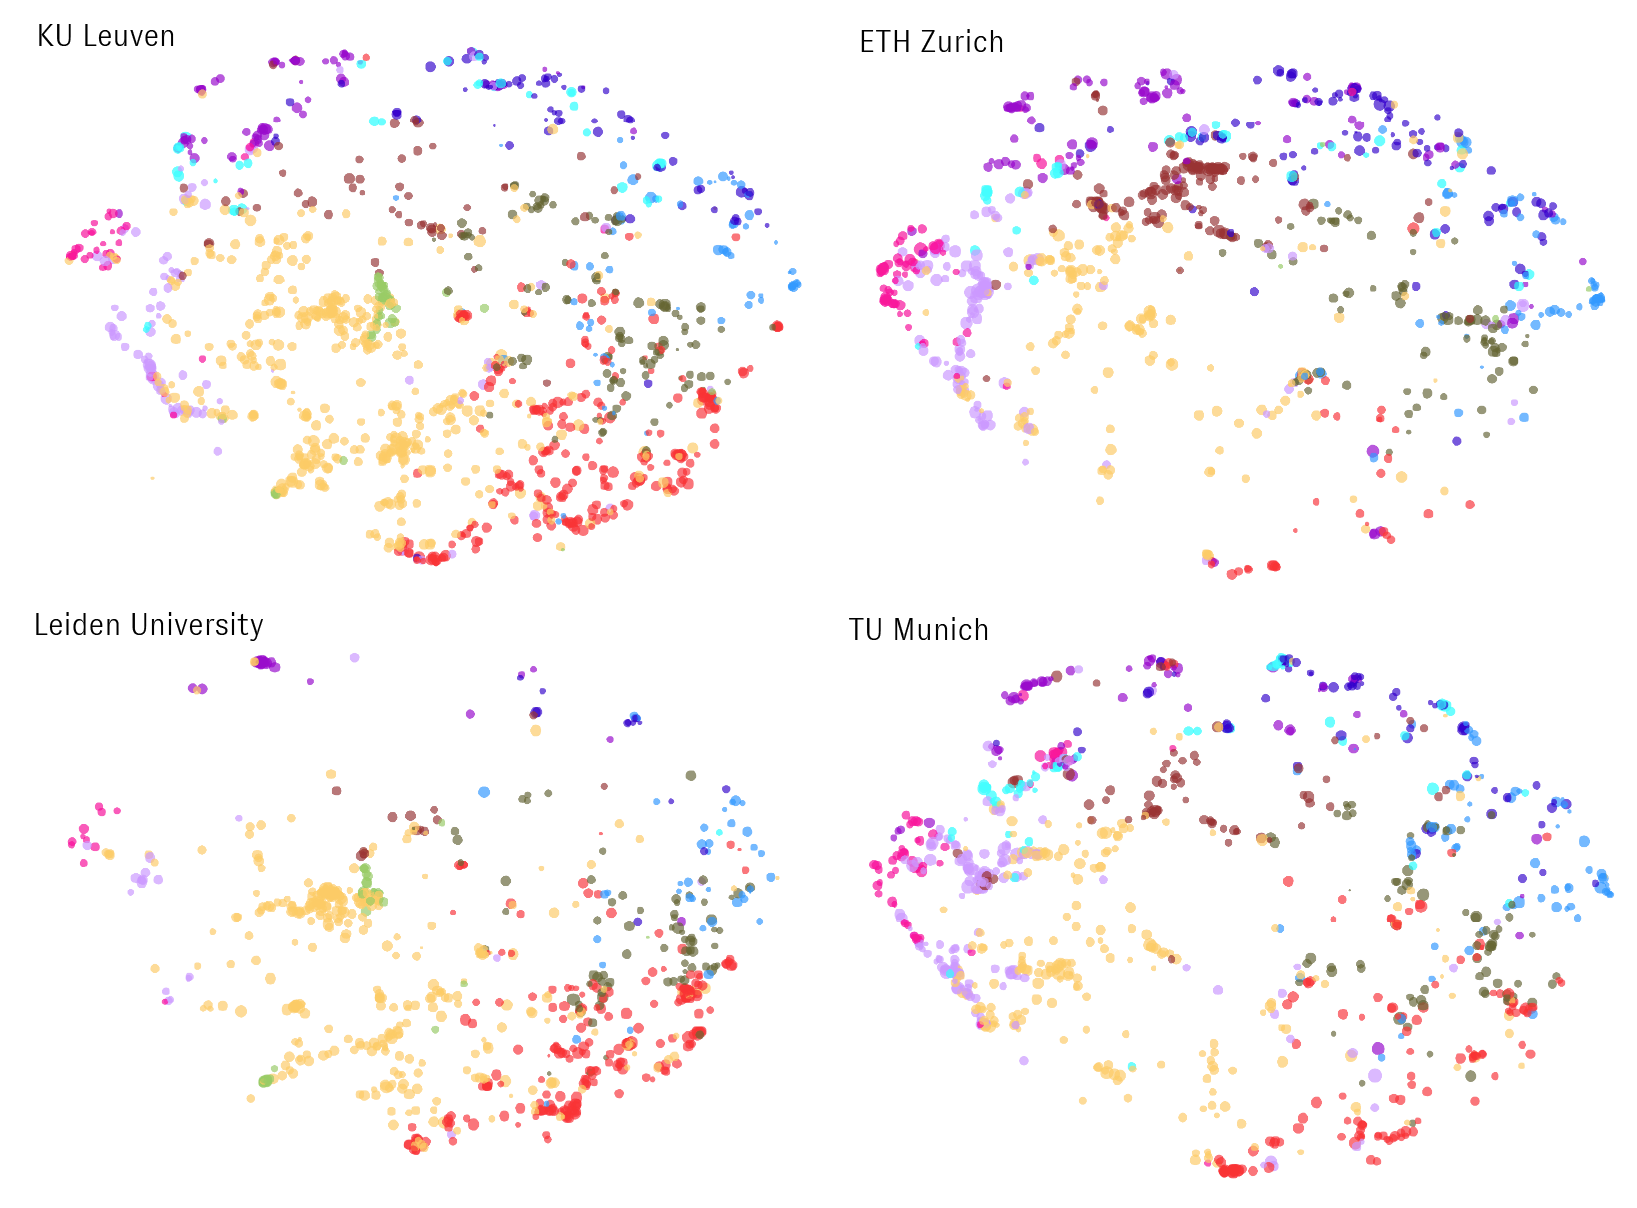
Leiden is also more heavily represented in social science and medicine clusters than ETH Zurich or TU Munich; TU Munich's map looks more similar to ETH Zurich's, but with more medicine clusters. Each university has a notably different distribution of leadership clusters within these different subject matter areas, as well. Exploring these patterns with the Map's map, list, and detail views can help uncover their meaning, as in our case study of Leuven's cryptography program above.
In our last post in this series, we'll use the Map to profile some leading Chinese schools and their research strengths. In the meantime, give the Map a try at sciencemap.eto.tech - or feel free to contact us to learn more. 🤖