Overview
What is this tool?
PATHWISE (Prototype Analytics for Tracking High-Demand Workforce in Innovative Skill Ecosystems) is ETO’s hub for identifying and analyzing emerging technology talent in the United States. Building on CSET's workforce research, it maps the supply and demand of the AI and cybersecurity workforce across U.S. states and Core-Based Statistical Areas (CBSAs). It also highlights the educational institutions that produce this talent by degree level, allowing users to explore the technology talent development pipeline.
What can I use it for?
Use PATHWISE to:
- Assess the U.S. emerging technology workforce by examining employment and education metrics across states and CBSAs.
- Explore and compare regional hubs within the emerging technology workforce.
- Analyze the emerging technology education pipeline by degree level, and identify universities that produce the most number of graduates in these fields.
What are its most important limitations?
- Workforce demand and supply counts include active and potential tech talent. Our methodology for identifying the AI and cybersecurity workforce, using Standard Occupational Classification (SOC) codes, includes occupations that are actively in the emerging technology workforce and those that potentially could be part of it.
- PATHWISE includes bachelor’s, master’s and doctoral degrees but does not currently include associate’s degrees or non-degree awards programs.
- Education metrics lag behind the workforce metrics. PATHWISE includes education data from 2023, and workforce data from January–August 2025. We aim to reduce the time lag between these sources as new data will be added regularly.
- PATHWISE inherits additional limitations from its source datasets, including:
- Workforce demand only indicates the number of job postings. We do not have any information on whether a given posting was filled or not.
- Workforce data largely relies on online activity. The underlying data for workforce variables come from online job postings and profiles, and postings and/or profiles that don’t have a digital presence may be excluded.
What are its sources?
PATHWISE relies on Lightcast’s job postings and worker profiles data for the workforce metrics, and on the U.S. Department of Education's National Center for Education Statistics (NCES) Integrated Postsecondary Education Data System (IPEDS) data for education metrics.
Does it contain sensitive information, such as personally identifiable information?
No
What are the terms of use?
The PATHWISE tool and metrics are subject to ETO’s general terms of use. If you use the tool in your work, please cite us. The PATHWISE dataset is not publicly available due to licensing restrictions.
How do I cite it?
Please cite "CSET Emerging Technology Observatory PATHWISE" (including the link).
Using PATHWISE
How do I use it?
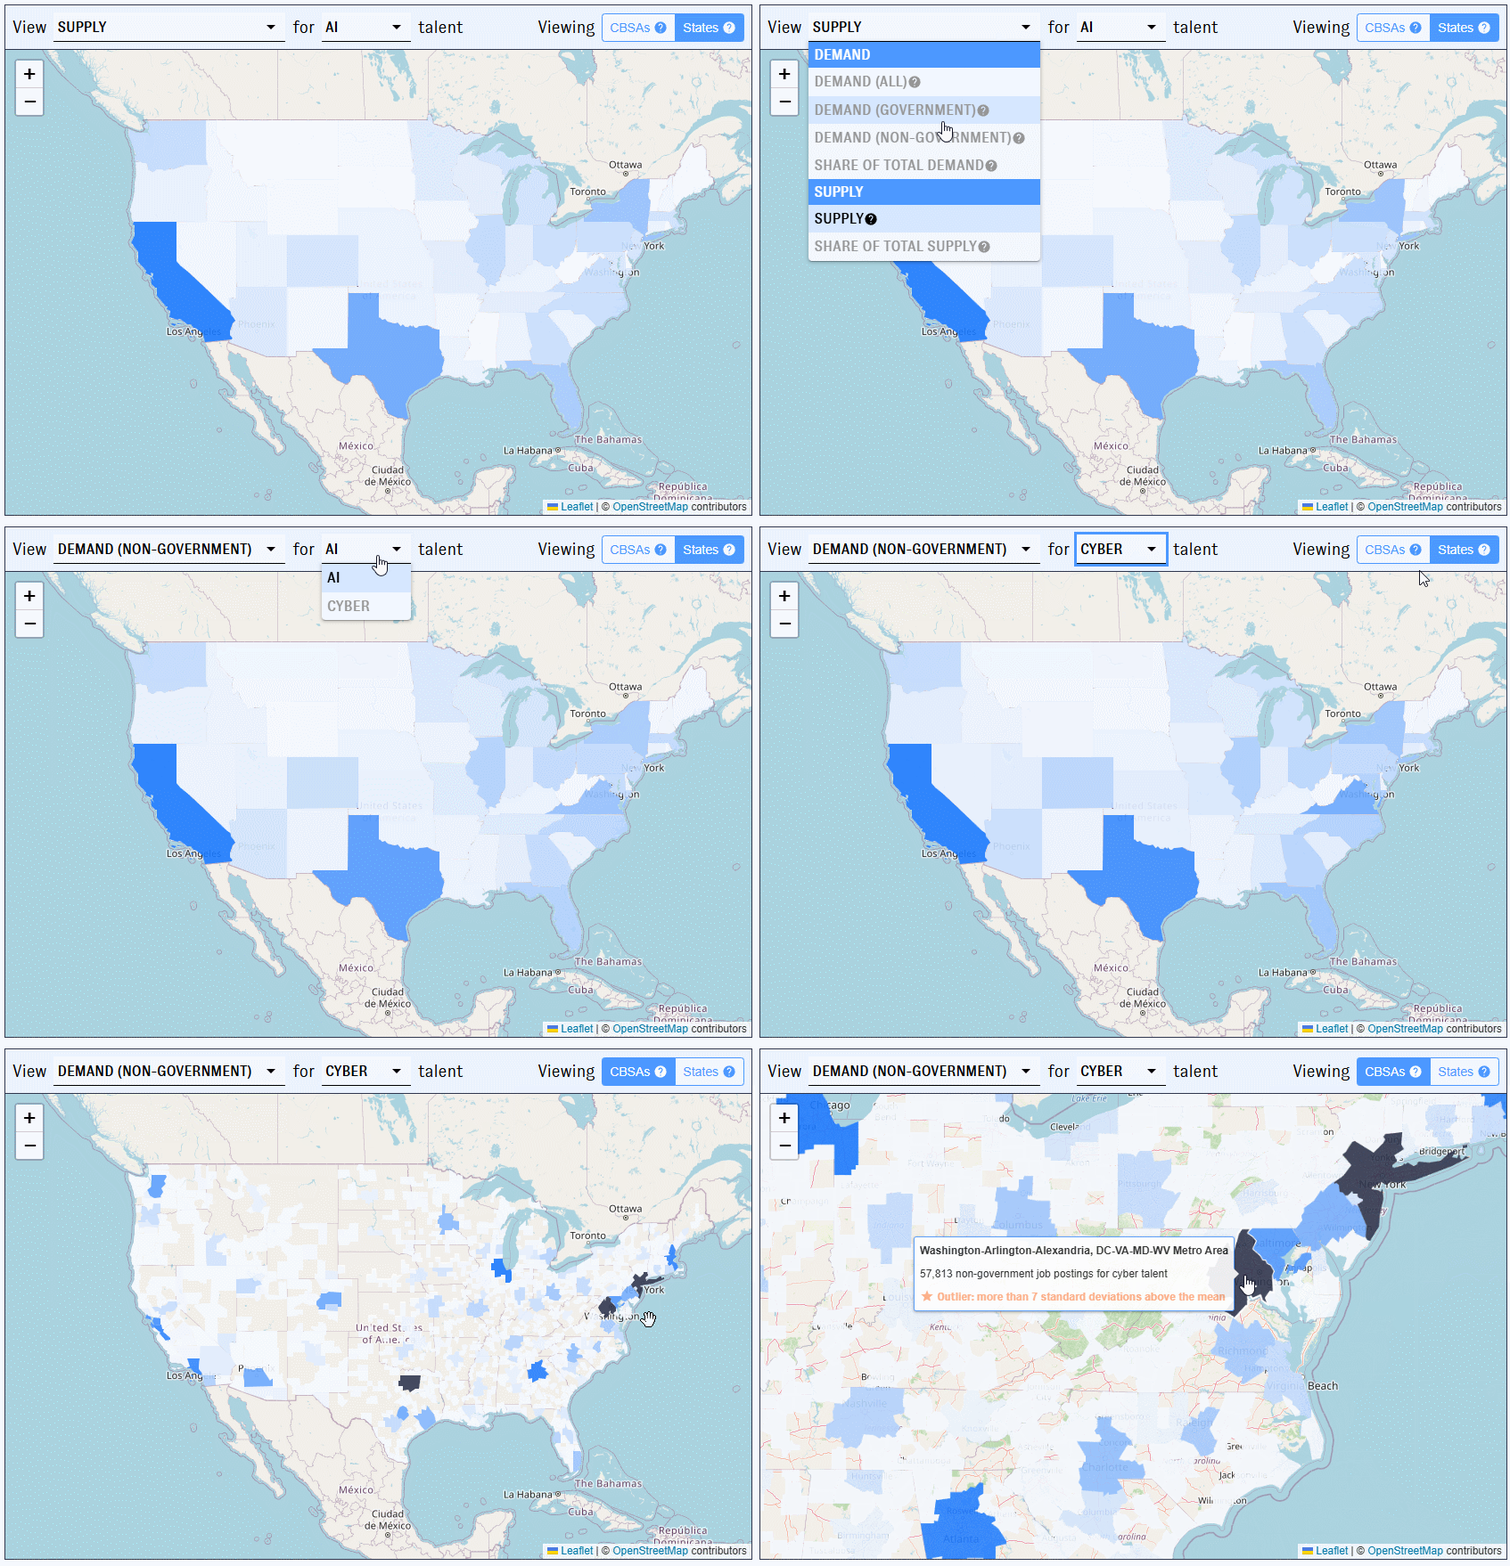
PATHWISE’s main view is a map-based dashboard to visualize workforce supply and demand. The table view displayed below the map presents the same data for the selections made in the map. More information about each view is explained below:
Map View: Start by selecting a workforce topic, geographic region, or emerging technology talent type. Hover over the question mark icons to display helpful explanations for each selection. Each region on the map is shaded according to its value - darker regions represent higher values, while lighter regions indicate lower values. The darkest shade is used to highlight outliers, which we identify as values that are seven standard deviations above the mean for the data subset for a given selection.

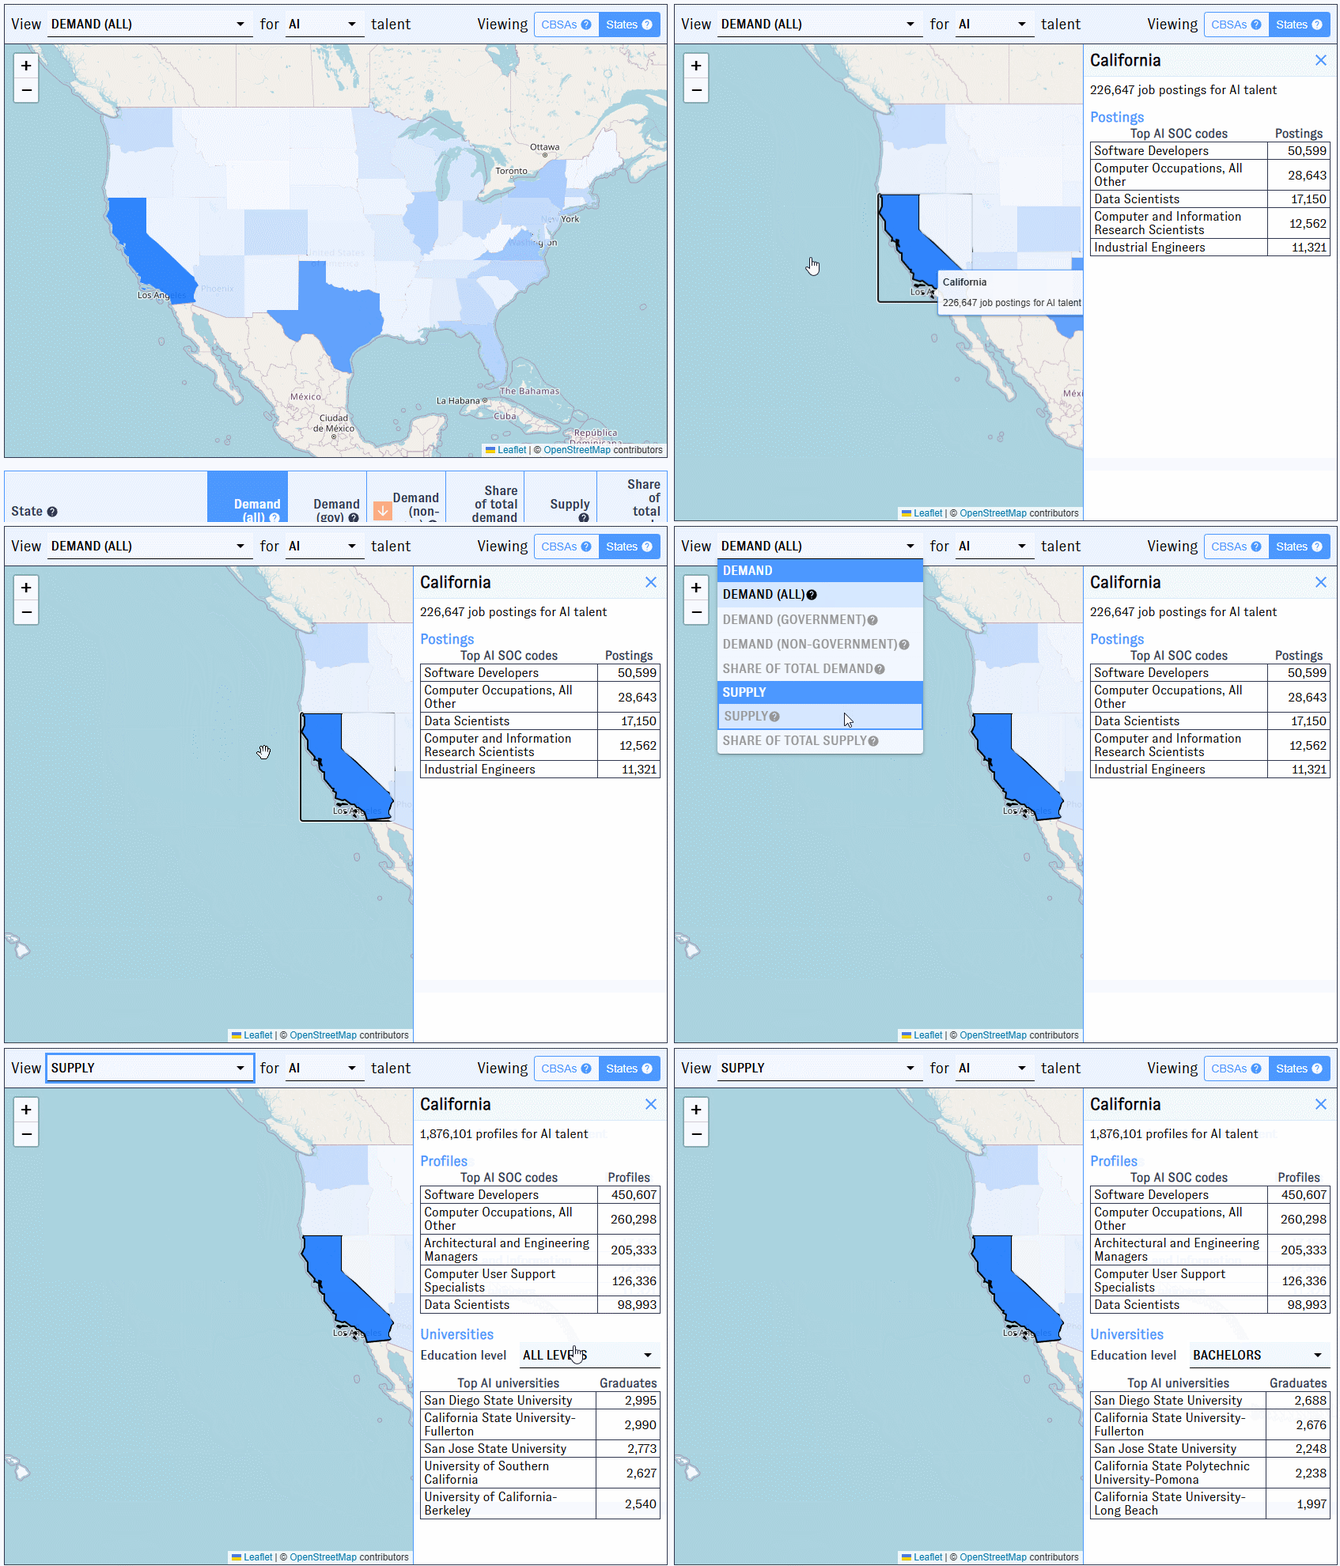
As you click on a geographic region, the right-hand sidebar displays additional metrics for each workforce topic, as outlined below:

Workforce demand:
- The top five occupations among job postings for selected emerging technology.
Workforce supply:
- The top five occupations among employee profiles in selected emerging technology.
- The top five universities in the region producing graduates in selected emerging technology. (Use the education level drop down menu to switch between degree levels.)
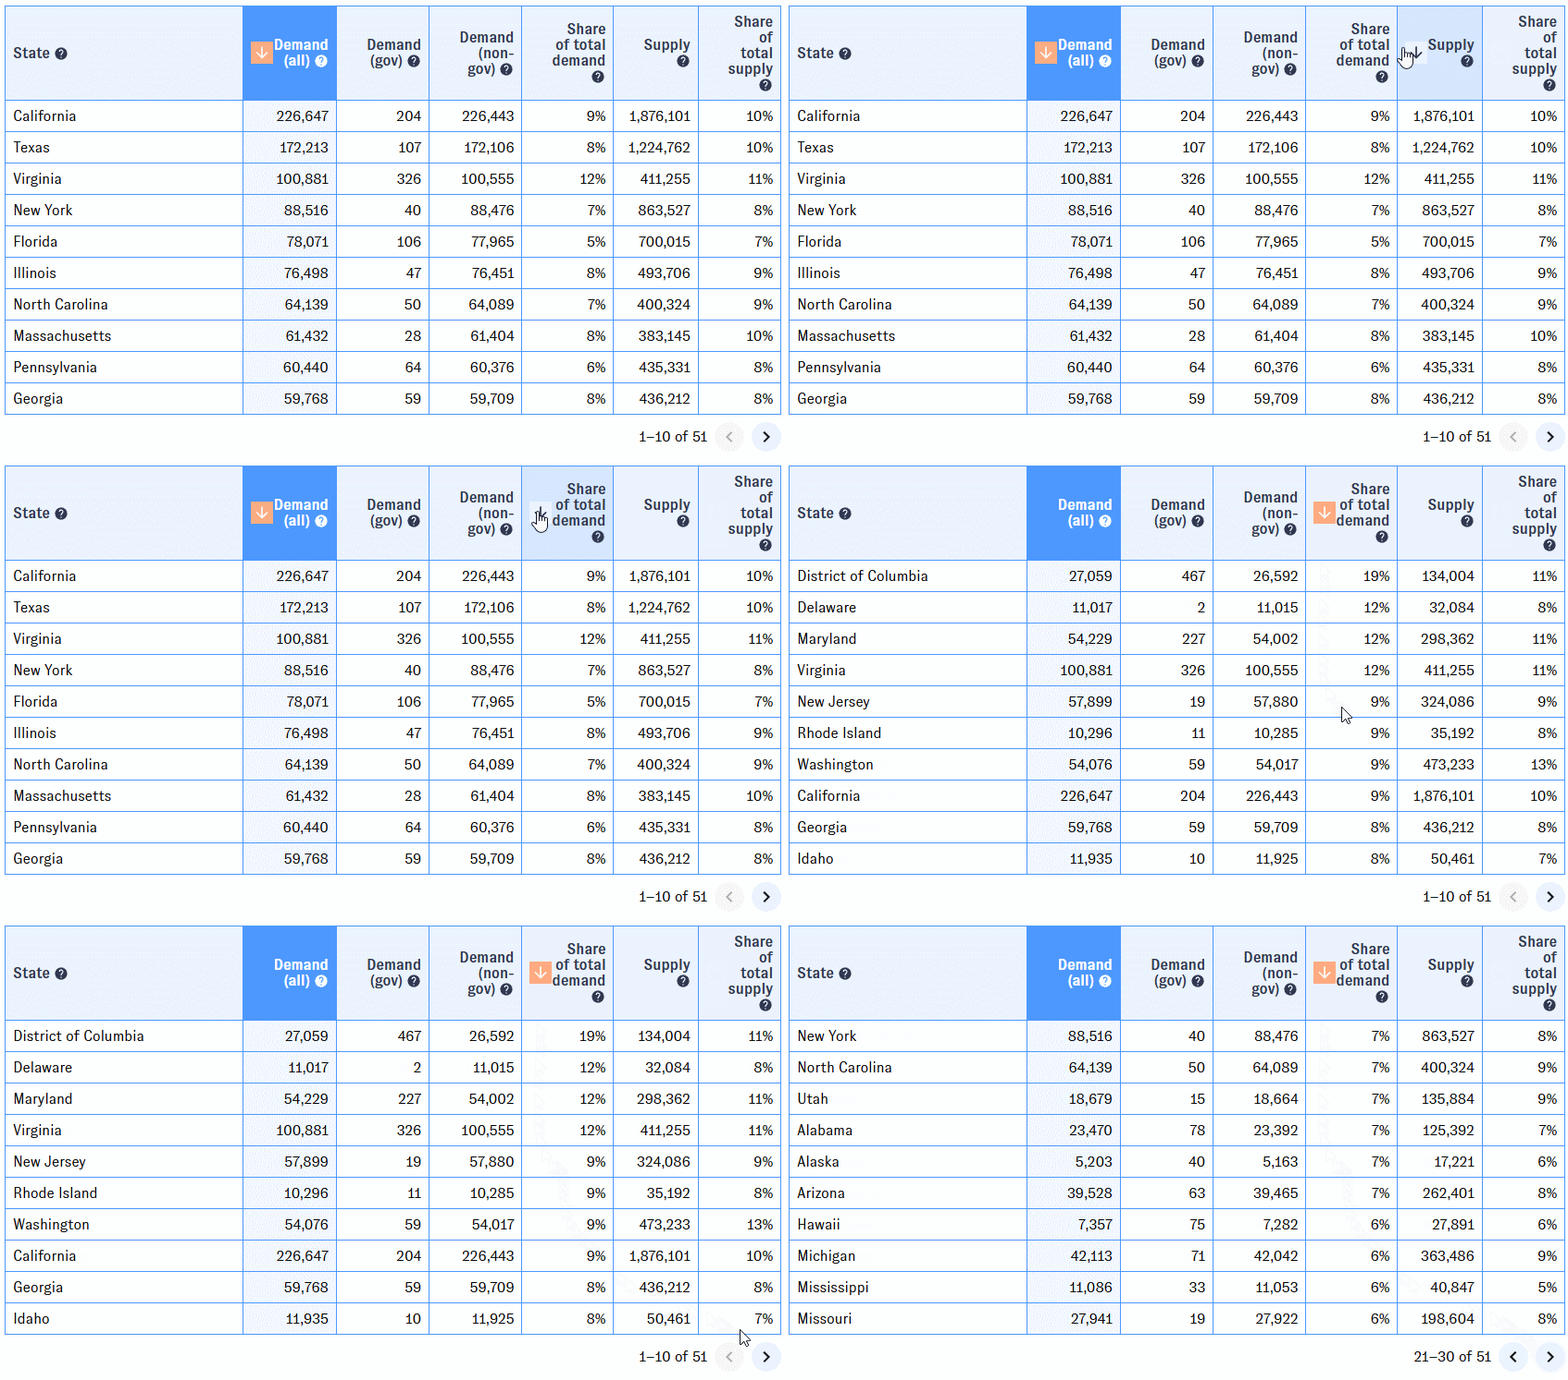
Table View: The table view displays the workforce and education metrics for the geographic region and emerging technology type selected in the map. The table is paginated for easier browsing, and each column can be sorted for easier analysis.

Returning to a specific page: As you work with PATHWISE, your browser’s address bar will update to reflect the applied selections. Copy the URL in order to return to the same view later.
What can I use it for?
You can use PATHWISE to:
- Assess the emerging technology workforce by examining workforce and education metrics across U.S. states and CBSAs. The state-level view provides a high-level picture of the emerging technology talent, while CBSAs help identify the talent hubs.
- How is cybersecurity demand distributed across U.S. states? Do we find similar trends across CBSAs?
- Where are the AI talent hubs in the U.S.? Do universities in these regions produce a high number of AI graduates?
- Explore and compare regional hubs within the emerging technology workforce. PATHWISE displays the count and percent share of emerging technology workforce demand and supply by region. Workforce demand is further divided as job postings from the federal government or private sector. In addition, each region also highlights the top emerging technology occupations (based on SOC codes) in demand or supply. Together, these variables deepen our understanding of the regional dynamics in the emerging technology workforce.
- What is the demand for federal AI jobs in the Washington-Arlington-Alexandria CBSA region? Where are other regional hotspots for federal AI jobs?
- Which cybersecurity jobs/job titles are most in demand in New York?
- Analyze the emerging technology education pipeline by degree level, and identify universities that produce the most number of graduates in these fields. PATHWISE includes recent graduates for the selected emerging technology and region, providing a fuller picture of the regional emerging technology workforce supply.
- Which educational institutions in California are producing the most cybersecurity graduates? And are the number of graduates consistent across different educational levels?
Which uses are not recommended?
-
Drawing firm conclusions about the emerging technology workforce solely based on PATHWISE: While PATHWISE helps in exploring the technology ecosystem, it cannot explain why certain regions exhibit specific trends. These trends may depend on factors beyond workforce and education, such as access to funding, or policy initiatives.
-
Comparing supply shares with total population estimates: Our calculations for the share of emerging technology employee profiles are based on the total number of employed individuals in a region. These aren’t directly comparable to the total population metrics for the region.
Sources and Methodology:
PATHWISE is built by consolidating data from the following sources:
- Lightcast job postings data to describe workforce demand
- Lightcast worker profiles data to describe workforce supply
- Integrated Postsecondary Education Data System (IPEDS) data from the U.S. Department of Education's National Center for Education Statistics (NCES) to describe education metrics.
The Lightcast data are cleaned and transformed using CSET’s definitions of the AI and cybersecurity workforce. We also developed methods to identify relevant education programs from IPEDS data. Visit the dataset’s documentation to learn more about the methodology used in building the underlying dataset.
Maintenance
How is it updated?
The PATHWISE interface is updated intermittently as we develop new features. The workforce metrics from Lightcast are updated monthly and education metrics from NCES IPEDS are updated annually.
How can I report an issue?
Use our general issue reporting form.
Credits
- Concept: Catherine Aiken, Dewey Murdick, Matthias Oschinski
- Design and analysis: Catherine Aiken, Zach Arnold, Jacob Feldgoise, Brian Love, Matthias Oschinski, Sonali Subbu Rathinam
- Engineering: Brian Love
- Review and testing: Jacob Feldgoise, Veronica Kinoshita, Adrian Thinnyun
- Documentation: Sonali Subbu Rathinam
- Maintenance: Brian Love, Sonali Subbu Rathinam
The PATHWISE tool is based on work supported by CSET’s partnership with the NobleReach Foundation.
Major change log
| 2025-10-30 | Initial release |