
Attention Substack users! ETO blog posts are also available on Substack.
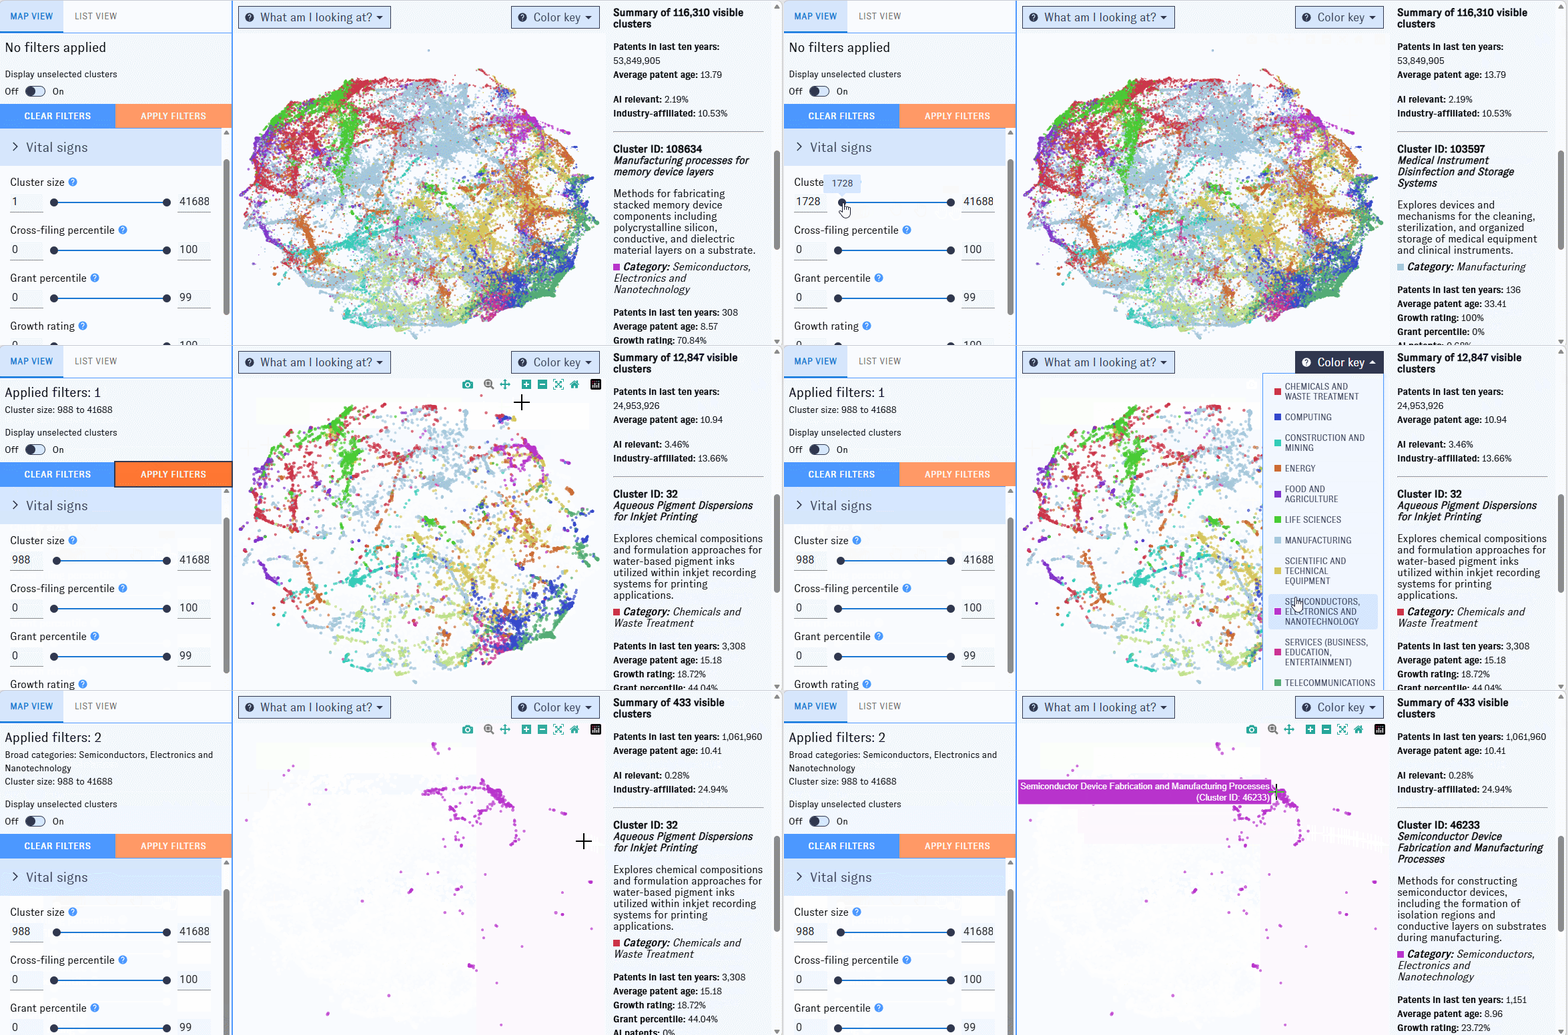
We're excited to introduce the Map of Patents, ETO's new tool for exploring the global innovation landscape. A companion to our Map of Science, the Map of Patents links and organizes hundreds of millions of patent documents from 107 patent authorities – including USPTO, EPO, WIPO, CNIPA, and JPO – into more than 116,000 clusters of related patents. For each cluster, the Map provides data on key focus areas, top assignees and inventors, significant patents, recent growth, grant rates, and other indicators, making it easy to pinpoint trends and key players in any area of commercial technology.
We built the Map of Patents using CSET's Research and Patent Cluster Dataset, which combines patent data from the Lens, PATSTAT provided by EPO, and 1790 Analytics. Clusters are generated algorithmically from citation links, text similarity, and the classification codes applied by patent examiners themselves, so they often capture precise real-world concepts - everything from computational methods for protein structure prediction to hydrogen storage and refueling station infrastructure - without you having to define topics in advance. Explore more details in our documentation and methodology!
The Map of Patents provides insights on the broader innovation landscape, and helps identify trends within specific industries and emerging technology areas. For example, the Map can answer questions like:
- Which areas of biotechnology patenting are growing fastest worldwide?
- Which countries and companies lead in robotics-related patenting?
- Where are AI techniques being incorporated into commercial applications, and who holds the key patents?
- Which patent clusters draw heavily on academic research?
CSET researchers have already used these patent clusters to evaluate the NIH's impact on research and innovation, trace how Canadian research funding translates into commercialization, and identify how AI techniques are being incorporated into mature applications. Now, we're excited to put the same data in the hands of researchers across academia, industry, and government.
The Map of Patents is live today at https://patentmap.eto.tech, along with detailed documentation about its interface, methodology, and limitations. As always, we value your feedback and are happy to help - visit our support hub to contact us with any questions or feedback, and book live support with an ETO staff member.